Download Queste statistiche in altri paesi:
Linea del tempo:
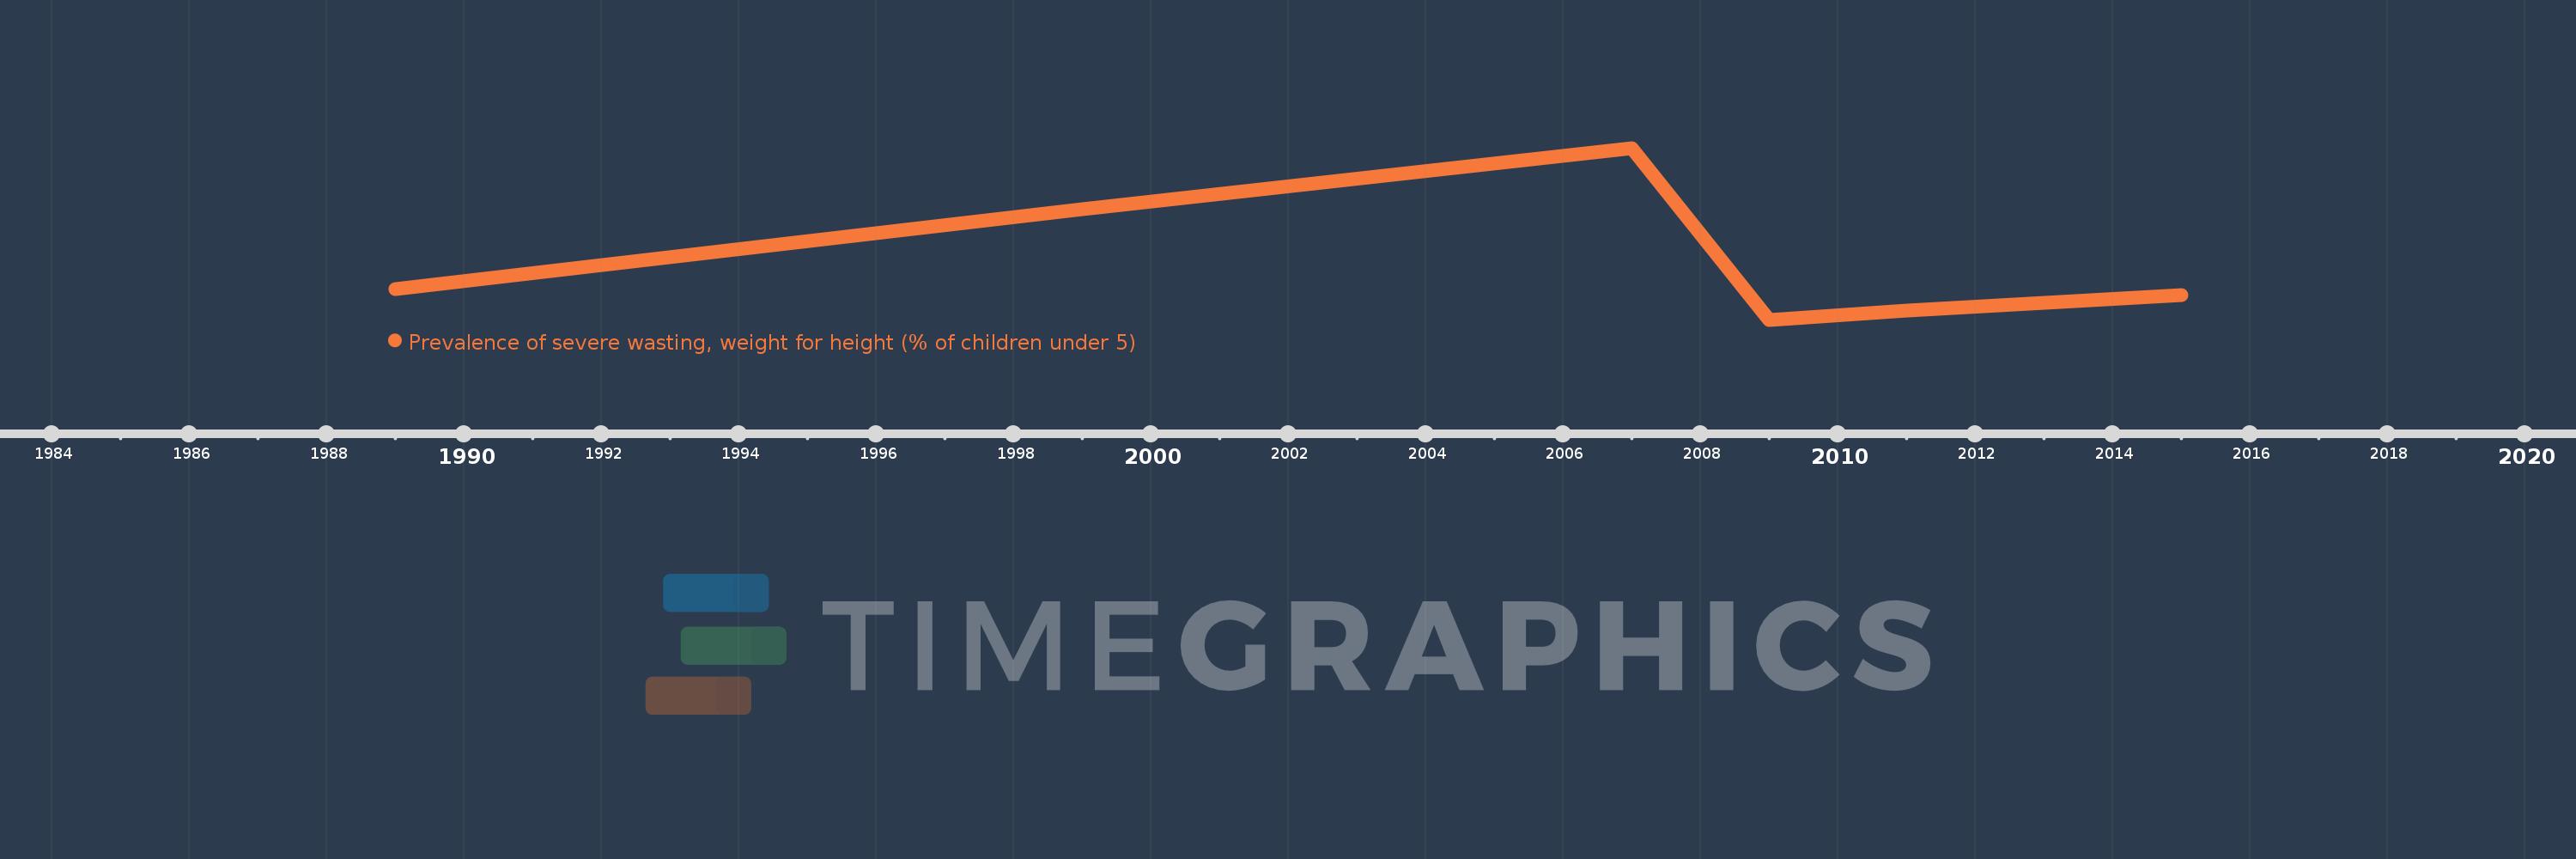
Questa scala temporale mostra un grafico dal 1989 anno al 2015 anno. Togo. I dati fino ad 1988 anno non disponibili. Il numero di osservazioni attuali secondo i date: 6.
La fonte (nome):
Indicatori dello sviluppo mondiale
La fonte (organizzazione):
World Health Organization, Global Database on Child Growth and Malnutrition. Country-level data are unadjusted data from national surveys, and thus may not be comparable across countries. Adjusted, comparable data are available at http://www.who.int/nutgrowthdb/en. Aggregation is based on UNICEF, WHO, and the World Bank harmonized dataset (adjusted, comparable data) and methodology.
Categorie:
Health
sono stati aggiornati
23 apr 2017 anni
Indicatori delle variazioni dei valori per anni
Minima:
0.7
1 gen 2009 anni
Massimo:
6.3
1 gen 2007 anni
Alla data di osservazione
Valore
Variazione assoluta
La variazione rispetto al valore precedente
1 gen 1989 anni
1.7
+1.7
0.0%
1 gen 1999 anni
4.3
+2.6
152.94%
1 gen 2007 anni
6.3
+2.0
46.51%
1 gen 2009 anni
0.7
-5.6
-88.89%
1 gen 2011 anni
1.0
+0.3
42.86%
1 gen 2015 anni
1.5
+0.5
50.0%
Classificazione dei paesi secondo i statistiche attuali per anni