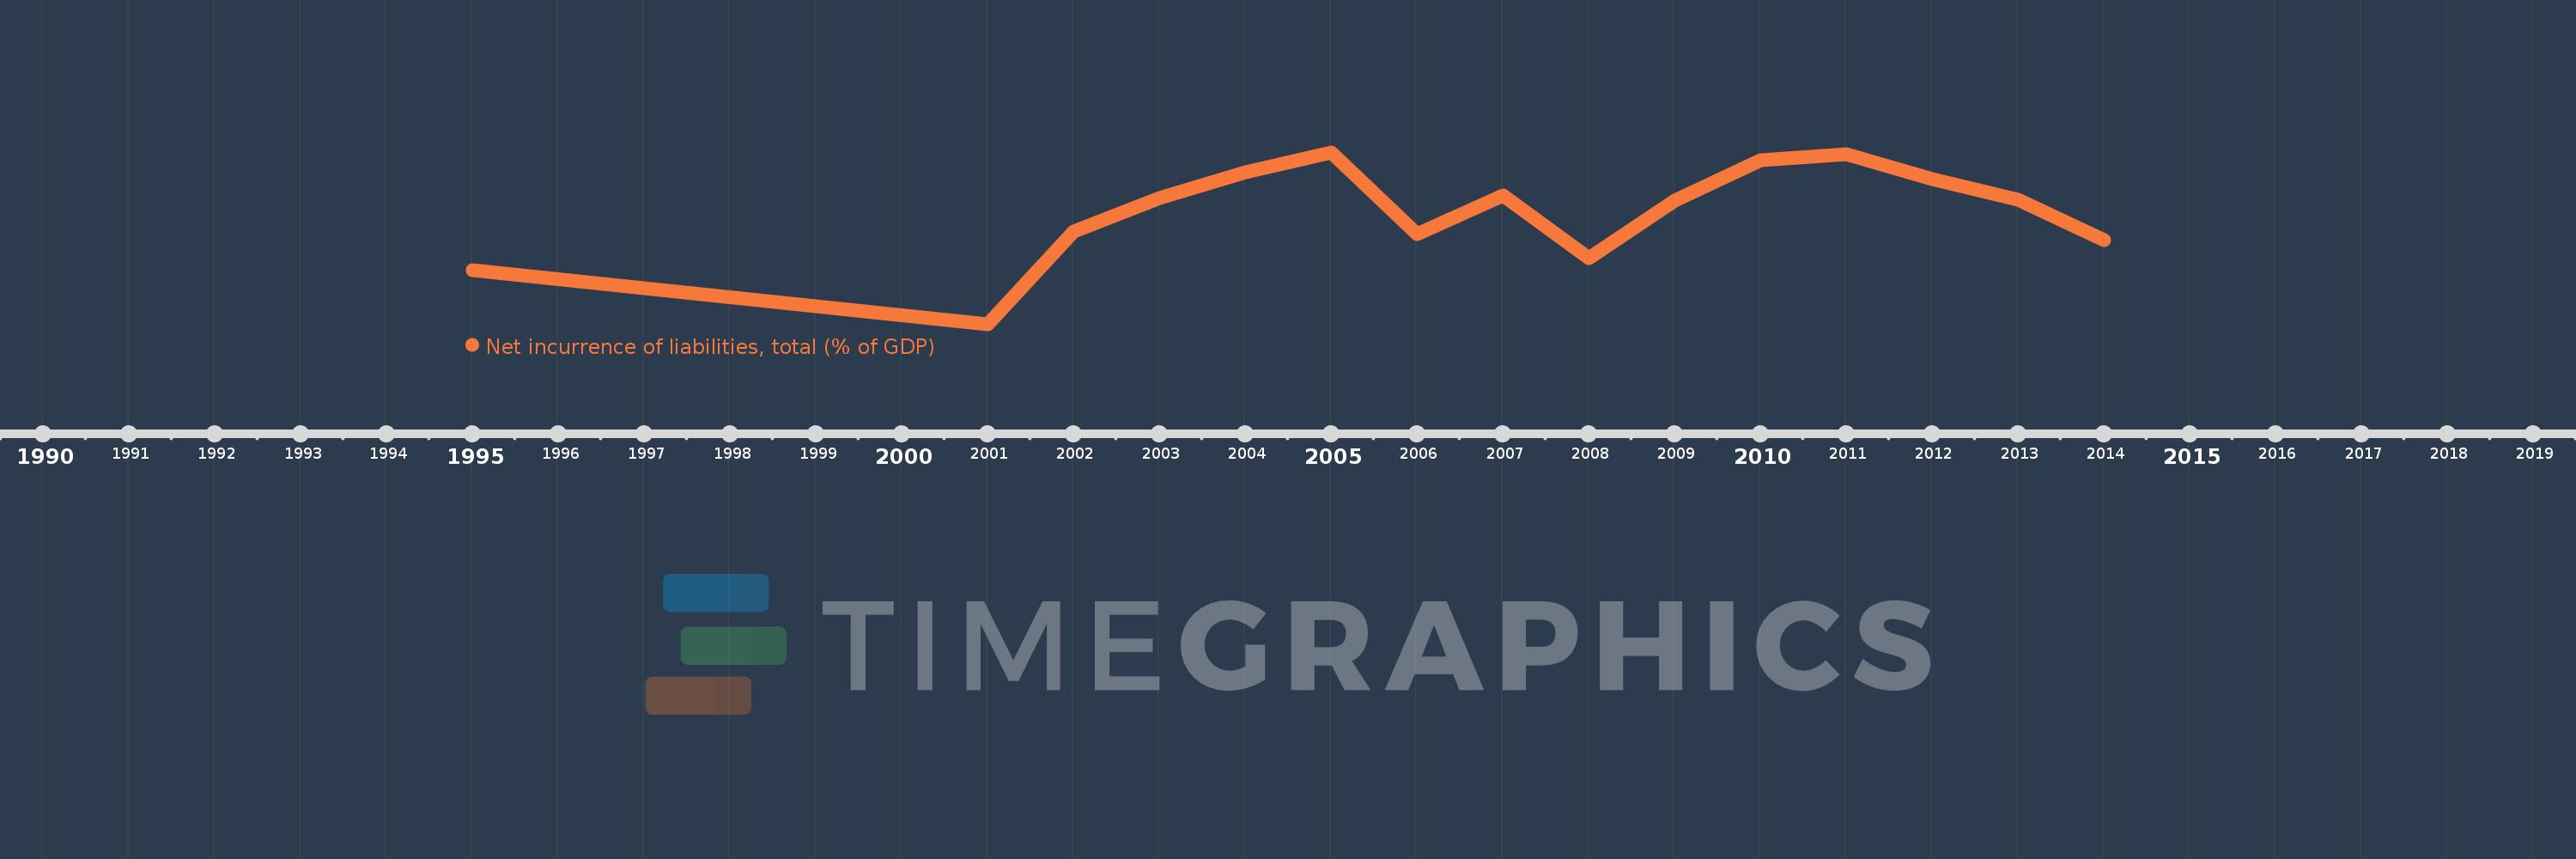
Questa scala temporale mostra un grafico dal 1995 anno al 2014 anno. Central Europe and the Baltics. I dati fino ad 1994 anno non disponibili. Il numero di osservazioni attuali secondo i date: 15.
La fonte (nome):
Indicatori dello sviluppo mondiale
La fonte (organizzazione):
International Monetary Fund, Government Finance Statistics Yearbook and data files.
Categorie:
Public Sector
sono stati aggiornati
23 apr 2017 anni
Indicatori delle variazioni dei valori per anni
In media:
3.624
Minima:
1.154
1 gen 2001 anni
Massimo:
4.913
1 gen 2005 anni
Alla data di osservazione
Valore
Variazione assoluta
La variazione rispetto al valore precedente
1 gen 1995 anni
2.334
+2.334
0.0%
1 gen 2001 anni
1.154
-1.179
-50.53%
1 gen 2002 anni
3.177
+2.022
175.18%
1 gen 2003 anni
3.913
+0.737
23.19%
1 gen 2004 anni
4.475
+0.562
14.35%
1 gen 2005 anni
4.913
+0.438
9.79%
1 gen 2006 anni
3.127
-1.786
-36.34%
1 gen 2007 anni
3.968
+0.84
26.86%
1 gen 2008 anni
2.601
-1.367
-34.45%
1 gen 2009 anni
3.867
+1.266
48.68%
1 gen 2010 anni
4.75
+0.883
22.83%
1 gen 2011 anni
4.875
+0.125
2.63%
1 gen 2012 anni
4.33
-0.545
-11.17%
1 gen 2013 anni
3.886
-0.444
-10.26%
1 gen 2014 anni
2.993
-0.893
-22.98%
Classificazione dei paesi secondo i statistiche attuali per anni