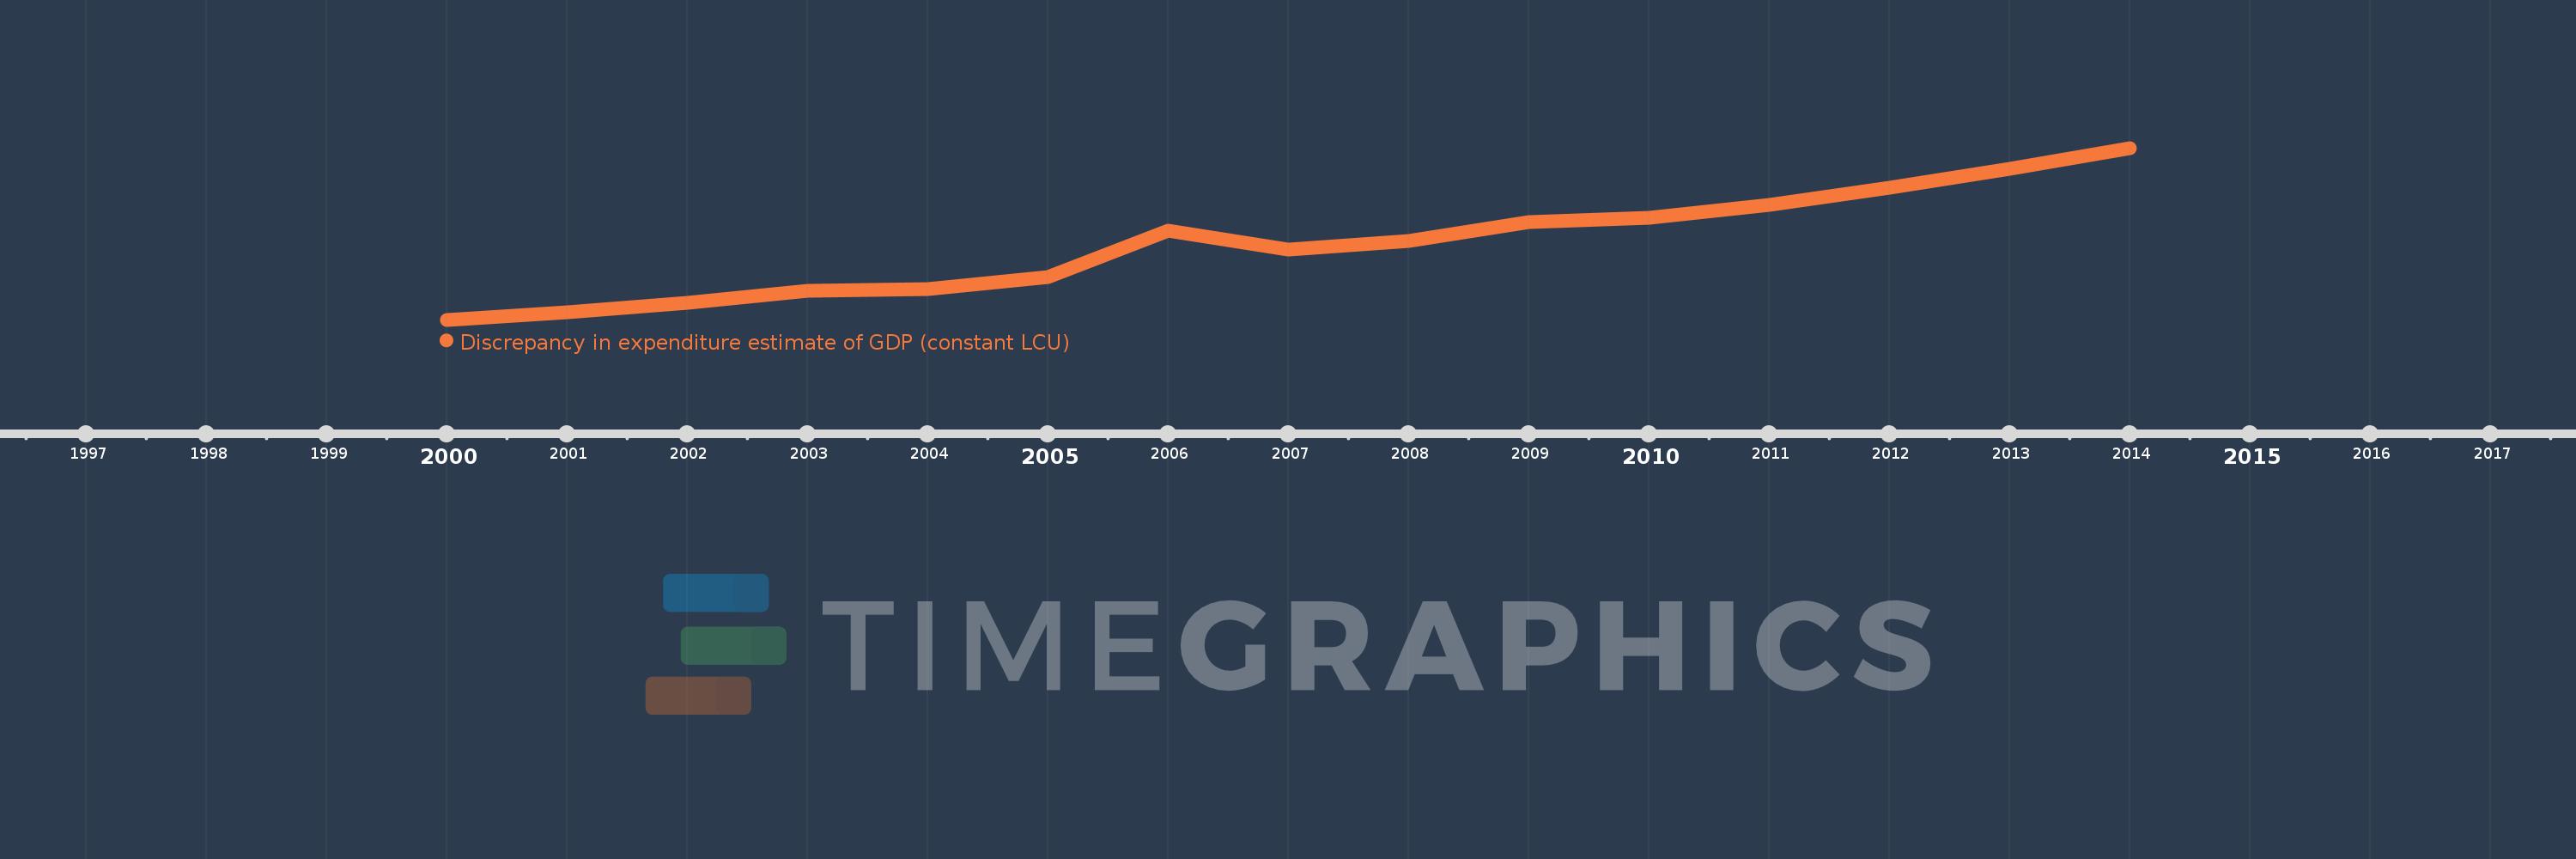
Questa scala temporale mostra un grafico dal 2000 anno al 2014 anno. Tajikistan. I dati fino ad 1999 anno non disponibili. Il numero di osservazioni attuali secondo i date: 15.
La fonte (nome):
Indicatori dello sviluppo mondiale
La fonte (organizzazione):
World Bank national accounts data, and OECD National Accounts data files.
Categorie:
Economy & Growth
sono stati aggiornati
23 apr 2017 anni
Indicatori delle variazioni dei valori per anni
In media:
692.846 Mln
Minima:
-179.161 Mln
1 gen 2000 anni
Massimo:
1.803 Mlrd
1 gen 2014 anni
Alla data di osservazione
Valore
Variazione assoluta
La variazione rispetto al valore precedente
1 gen 2000 anni
-179.161 Mln
-179.161 Mln
0.0%
1 gen 2001 anni
-89.108 Mln
+90.053 Mln
-50.26%
1 gen 2002 anni
14.986 Mln
+104.095 Mln
-116.82%
1 gen 2003 anni
151.089 Mln
+136.103 Mln
908.17%
1 gen 2004 anni
177.002 Mln
+25.913 Mln
17.15%
1 gen 2005 anni
316.14 Mln
+139.138 Mln
78.61%
1 gen 2006 anni
845.619 Mln
+529.479 Mln
167.48%
1 gen 2007 anni
629.642 Mln
-215.977 Mln
-25.54%
1 gen 2008 anni
726.423 Mln
+96.781 Mln
15.37%
1 gen 2009 anni
945.269 Mln
+218.846 Mln
30.13%
1 gen 2010 anni
1.002 Mlrd
+56.438 Mln
5.97%
1 gen 2011 anni
1.146 Mlrd
+144.496 Mln
14.42%
1 gen 2012 anni
1.342 Mlrd
+195.343 Mln
17.04%
1 gen 2013 anni
1.563 Mlrd
+221.027 Mln
16.48%
1 gen 2014 anni
1.803 Mlrd
+240.189 Mln
15.37%
Classificazione dei paesi secondo i statistiche attuali per anni