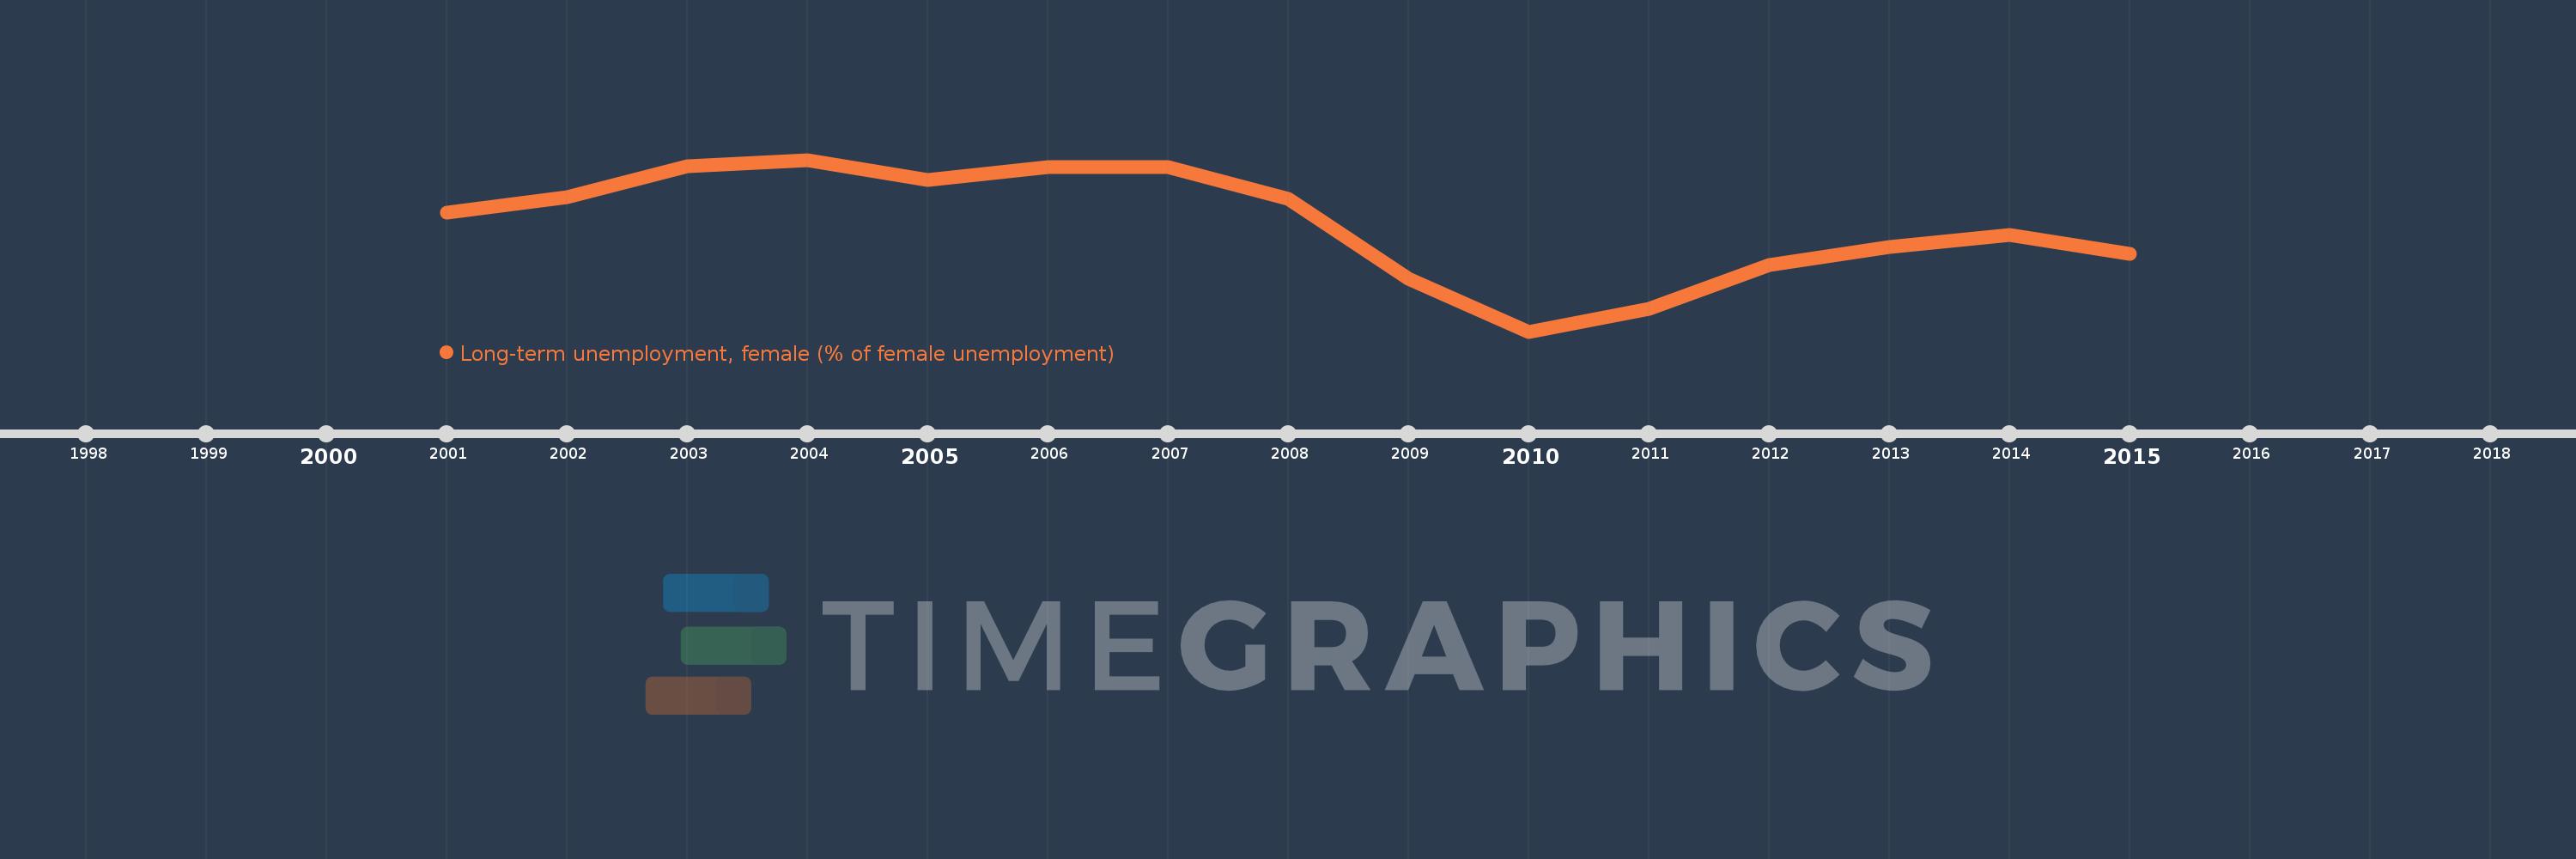
Questa scala temporale mostra un grafico dal 2001 anno al 2015 anno. Central Europe and the Baltics. I dati fino ad 2000 anno non disponibili. Il numero di osservazioni attuali secondo i date: 15.
La fonte (nome):
Indicatori dello sviluppo mondiale
La fonte (organizzazione):
International Labour Organization, Key Indicators of the Labour Market database.
Categorie:
Social Protection & Labor, Gender
sono stati aggiornati
23 apr 2017 anni
Indicatori delle variazioni dei valori per anni
In media:
46.787
Minima:
34.097
1 gen 2010 anni
Massimo:
54.473
1 gen 2004 anni
Alla data di osservazione
Valore
Variazione assoluta
La variazione rispetto al valore precedente
1 gen 2001 anni
48.254
+48.254
0.0%
1 gen 2002 anni
50.08
+1.826
3.79%
1 gen 2003 anni
53.665
+3.585
7.16%
1 gen 2004 anni
54.473
+0.808
1.51%
1 gen 2005 anni
52.084
-2.389
-4.39%
1 gen 2006 anni
53.585
+1.5
2.88%
1 gen 2007 anni
53.562
-0.023
-0.04%
1 gen 2008 anni
49.798
-3.763
-7.03%
1 gen 2009 anni
40.383
-9.415
-18.91%
1 gen 2010 anni
34.097
-6.286
-15.57%
1 gen 2011 anni
36.754
+2.657
7.79%
1 gen 2012 anni
42.024
+5.27
14.34%
1 gen 2013 anni
44.129
+2.105
5.01%
1 gen 2014 anni
45.55
+1.421
3.22%
1 gen 2015 anni
43.365
-2.185
-4.8%
Classificazione dei paesi secondo i statistiche attuali per anni