Questa scala temporale mostra un grafico dal 1998 anno al 2015 anno. Central Europe and the Baltics. I dati fino ad 1997 anno non disponibili. Il numero di osservazioni attuali secondo i date: 18.
La fonte (nome):
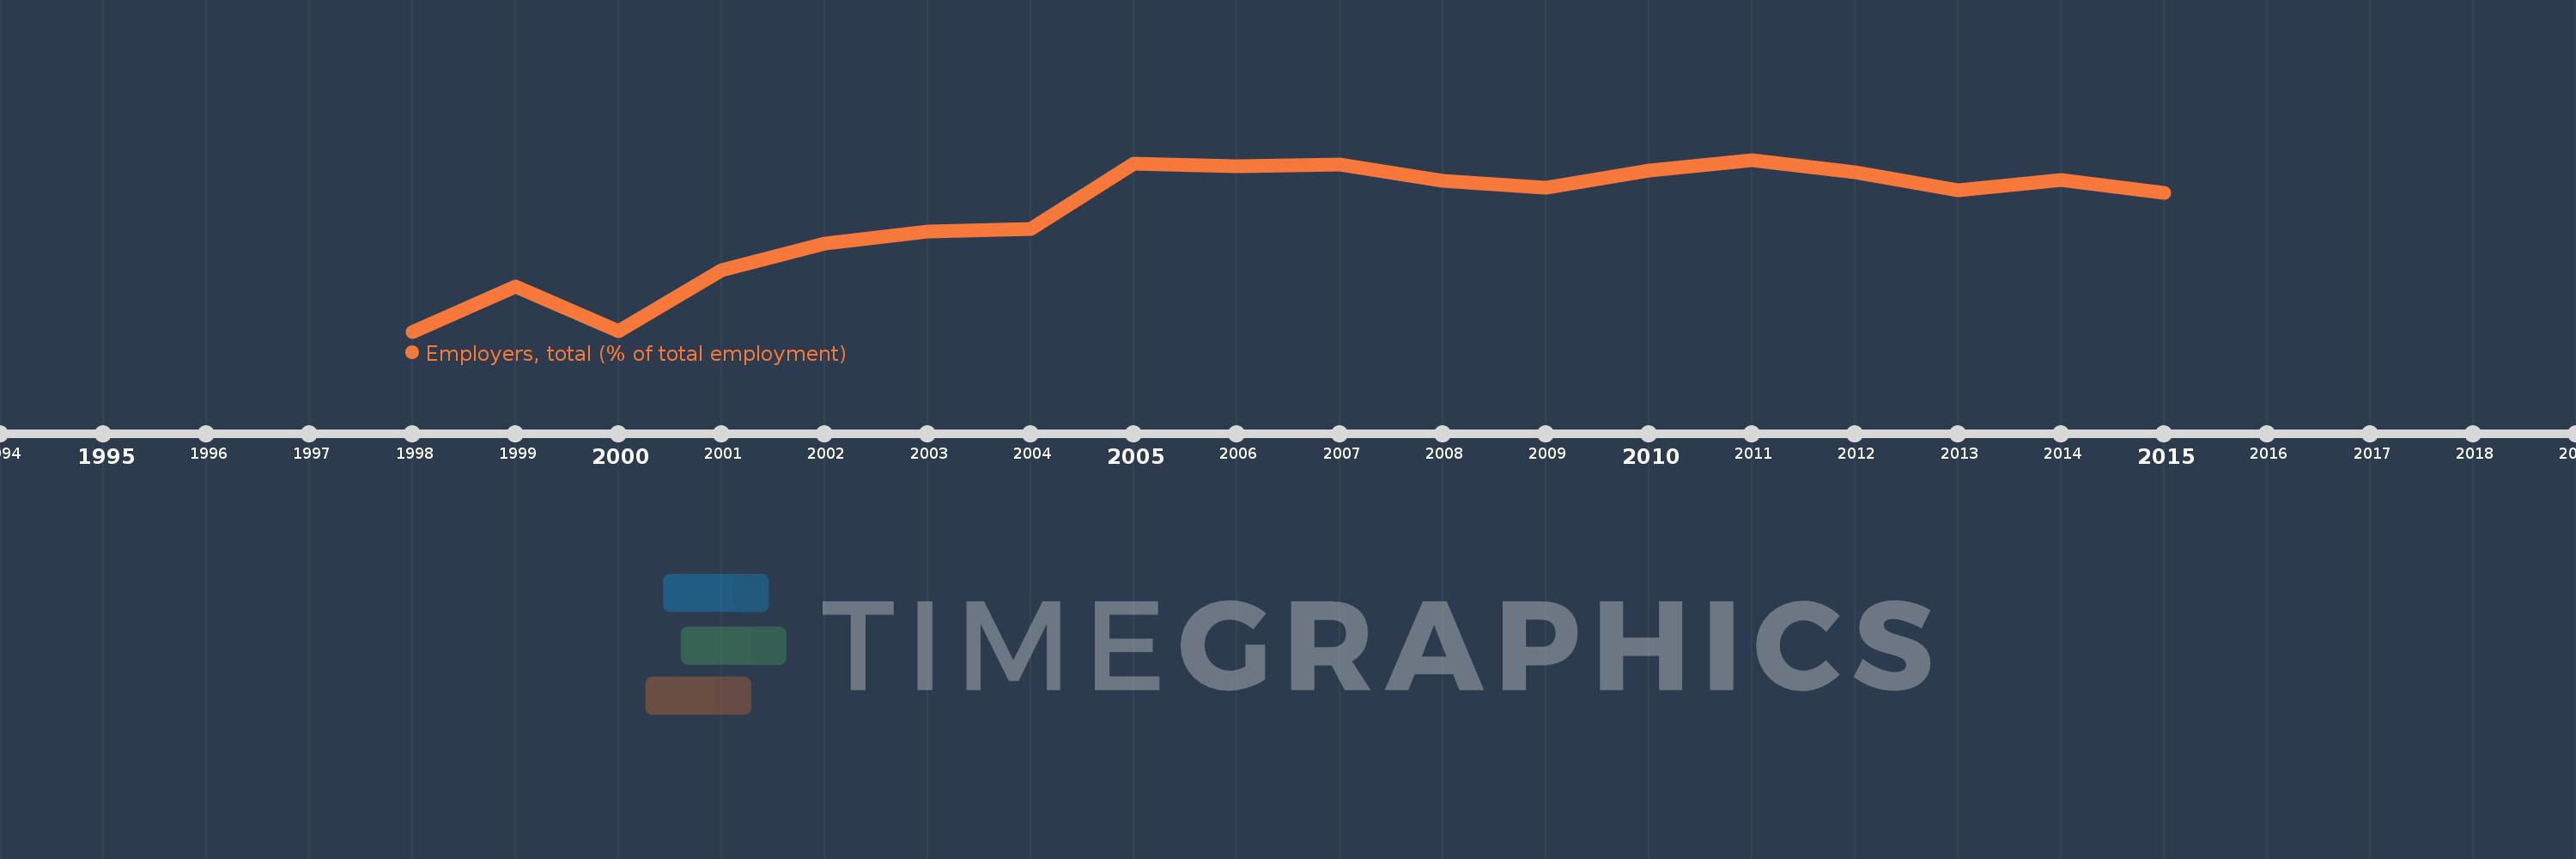
Indicatori dello sviluppo mondiale
La fonte (organizzazione):
ILO Key Indicators of the Labour Market (KILM).
Categorie:
Social Protection & Labor
sono stati aggiornati
23 apr 2017 anni
Indicatori delle variazioni dei valori per anni
In media:
3.349
Minima:
2.921
1 gen 1998 anni
Massimo:
3.546
1 gen 2011 anni
Alla data di osservazione
Valore
Variazione assoluta
La variazione rispetto al valore precedente
1 gen 1998 anni
2.921
+2.921
0.0%
1 gen 1999 anni
3.086
+0.165
5.67%
1 gen 2000 anni
2.923
-0.163
-5.28%
1 gen 2001 anni
3.144
+0.221
7.57%
1 gen 2002 anni
3.241
+0.097
3.08%
1 gen 2003 anni
3.284
+0.043
1.33%
1 gen 2004 anni
3.293
+0.009
0.26%
1 gen 2005 anni
3.531
+0.238
7.24%
1 gen 2006 anni
3.523
-0.008
-0.22%
1 gen 2007 anni
3.53
+0.007
0.19%
1 gen 2008 anni
3.471
-0.06
-1.69%
1 gen 2009 anni
3.443
-0.027
-0.78%
1 gen 2010 anni
3.506
+0.062
1.81%
1 gen 2011 anni
3.546
+0.04
1.15%
1 gen 2012 anni
3.5
-0.046
-1.3%
1 gen 2013 anni
3.435
-0.064
-1.84%
1 gen 2014 anni
3.472
+0.037
1.07%
1 gen 2015 anni
3.426
-0.046
-1.31%
Classificazione dei paesi secondo i statistiche attuali per anni