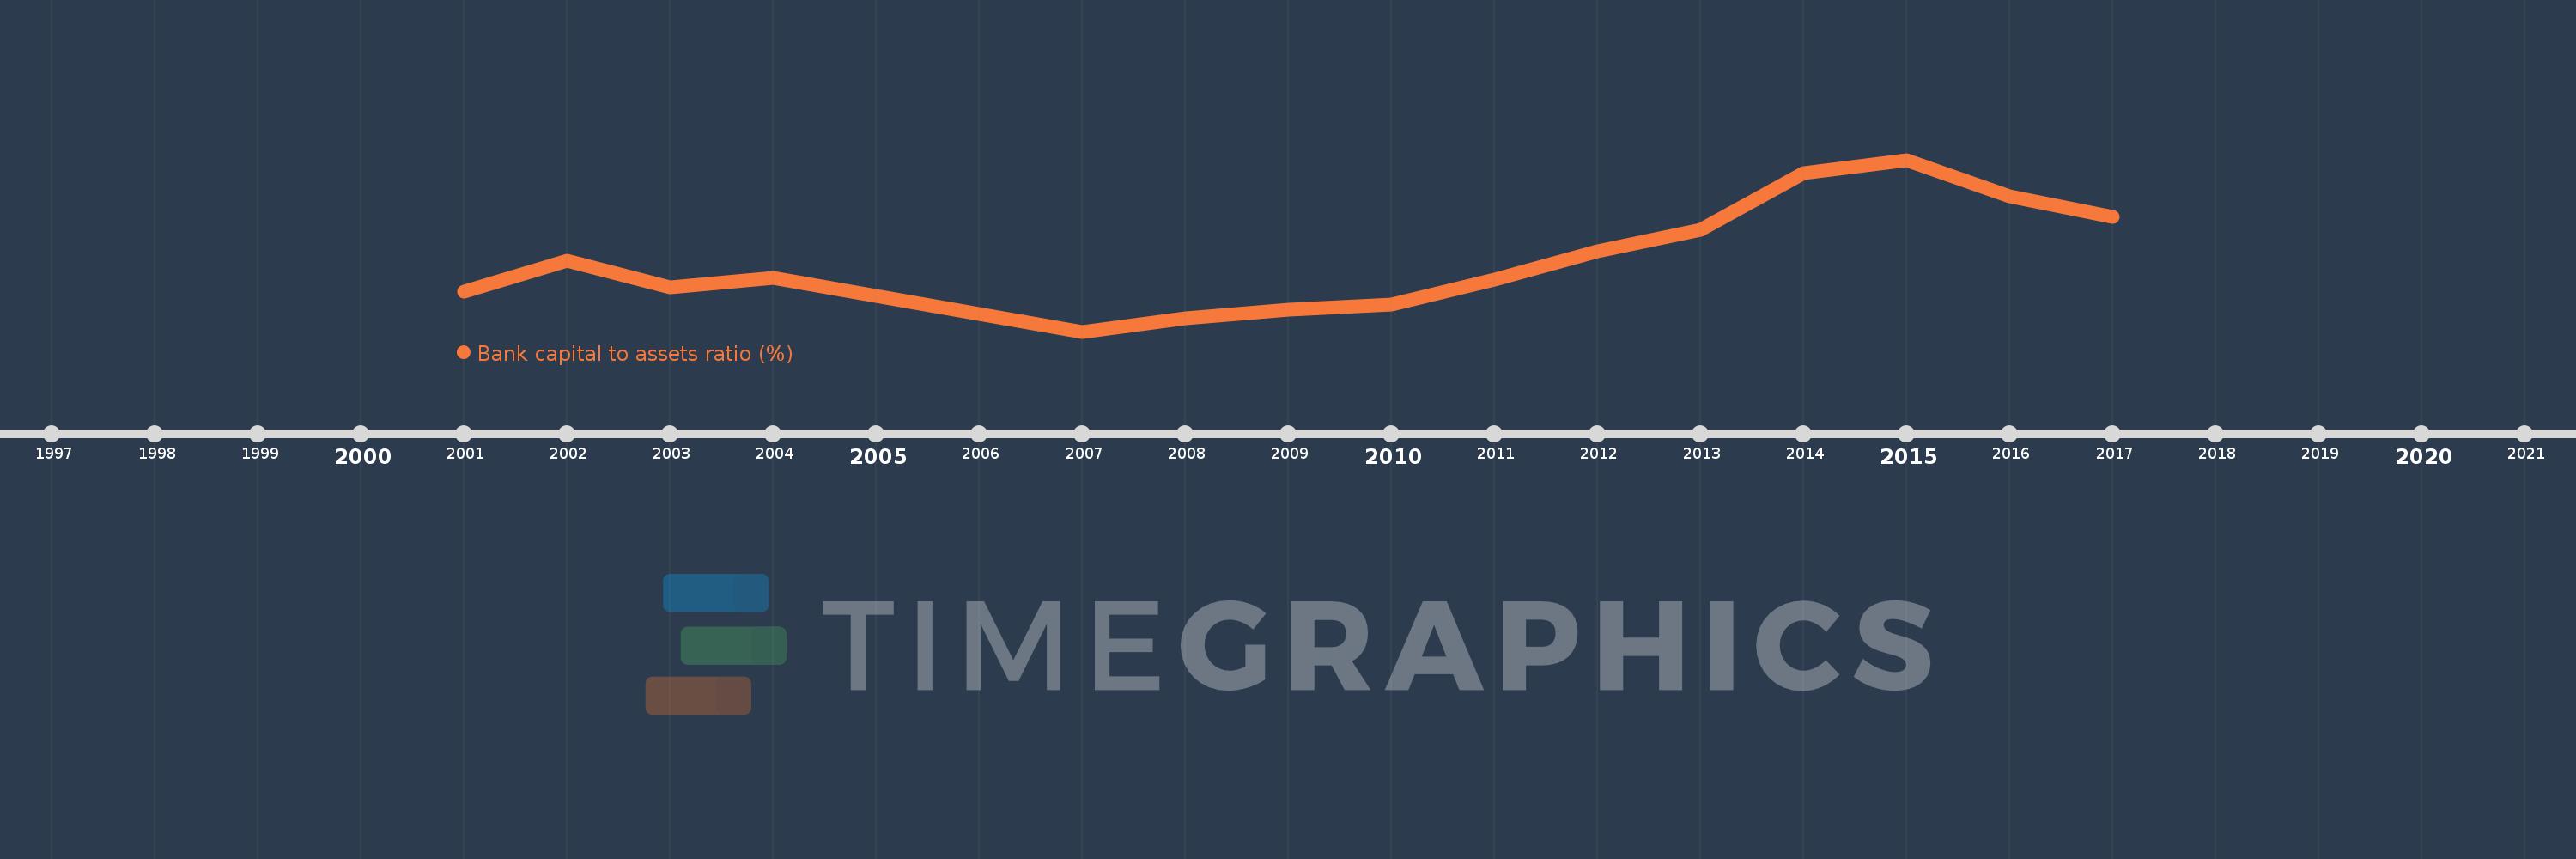
Questa scala temporale mostra un grafico dal 2001 anno al 2017 anno. Central Europe and the Baltics. I dati fino ad 2000 anno non disponibili. Il numero di osservazioni attuali secondo i date: 15.
La fonte (nome):
Indicatori dello sviluppo mondiale
La fonte (organizzazione):
International Monetary Fund, Global Financial Stability Report.
Categorie:
Financial Sector
sono stati aggiornati
23 apr 2017 anni
Indicatori delle variazioni dei valori per anni
In media:
9.329
Minima:
7.7
1 gen 2007 anni
Massimo:
11.567
1 gen 2015 anni
Alla data di osservazione
Valore
Variazione assoluta
La variazione rispetto al valore precedente
1 gen 2001 anni
8.6
+8.6
0.0%
1 gen 2002 anni
9.3
+0.7
8.14%
1 gen 2003 anni
8.7
-0.6
-6.45%
1 gen 2004 anni
8.9
+0.2
2.3%
1 gen 2007 anni
7.7
-1.2
-13.48%
1 gen 2008 anni
8.0
+0.3
3.9%
1 gen 2009 anni
8.2
+0.2
2.5%
1 gen 2010 anni
8.3
+0.1
1.22%
1 gen 2011 anni
8.879
+0.579
6.97%
1 gen 2012 anni
9.513
+0.634
7.15%
1 gen 2013 anni
9.99
+0.477
5.01%
1 gen 2014 anni
11.258
+1.268
12.7%
1 gen 2015 anni
11.567
+0.308
2.74%
1 gen 2016 anni
10.754
-0.813
-7.03%
1 gen 2017 anni
10.28
-0.474
-4.41%
Classificazione dei paesi secondo i statistiche attuali per anni