29
/it/
it
AIzaSyAYiBZKx7MnpbEhh9jyipgxe19OcubqV5w
April 1, 2024
25451
Central Europe and the Baltics
CEB
false
2
1
Adjusted net enrolment rate, primary, both sexes (%)
2015,2014,2013,2012,2011,2010,2009,2008,2007,2006,2005,2004,2003,2002,2001,2000,1999,1998
Download
Biblioteca di statistiche globali →Central Europe and the Baltics →

Adjusted net enrolment rate, primary, both sexes (%)

Queste statistiche in altri paesi:
AfghanistanAlbaniaAlgeriaAngolaAntigua and BarbudaArab WorldArgentinaArmeniaArubaAustraliaAustriaAzerbaijanBahamas, TheBahrainBangladeshBarbadosBelarusBelgiumBelizeBeninBermudaBhutanBoliviaBosnia and HerzegovinaBotswanaBrazilBrunei DarussalamBulgariaBurkina FasoBurundiCabo VerdeCambodiaCameroonCanadaCaribbean small statesCentral African RepublicCentral Europe and the BalticsChadChileChinaColombiaComorosCongo, Dem. Rep.Congo, Rep.Costa RicaCote d'IvoireCroatiaCubaCyprusDenmarkDjiboutiDominicaDominican RepublicEarly-demographic dividendEast Asia & PacificEast Asia & Pacific (excluding high income)East Asia & Pacific (IDA & IBRD countries)EcuadorEgypt, Arab Rep.El SalvadorEquatorial GuineaEritreaEstoniaEthiopiaEuro areaEurope & Central AsiaEurope & Central Asia (excluding high income)Europe & Central Asia (IDA & IBRD countries)European UnionFijiFinlandFragile and conflict affected situationsFranceGabonGambia, TheGeorgiaGermanyGhanaGreeceGrenadaGuatemalaGuineaGuinea-BissauGuyanaHaitiHeavily indebted poor countries (HIPC)High incomeHondurasHong Kong SAR, ChinaHungaryIBRD onlyIcelandIDA & IBRD totalIDA blendIDA onlyIDA totalIndiaIndonesiaIran, Islamic Rep.IraqIrelandIsraelItalyJamaicaJapanJordanKazakhstanKenyaKiribatiKorea, Dem. People’s Rep.Korea, Rep.KuwaitKyrgyz RepublicLao PDRLate-demographic dividendLatin America & Caribbean Latin America & Caribbean (excluding high income)Latin America & the Caribbean (IDA & IBRD countries)LatviaLeast developed countries: UN classificationLebanonLesothoLiberiaLibyaLiechtensteinLithuaniaLow & middle incomeLow incomeLower middle incomeLuxembourgMacao SAR, ChinaMacedonia, FYRMadagascarMalawiMalaysiaMaldivesMaliMaltaMarshall IslandsMauritaniaMauritiusMexicoMicronesia, Fed. Sts.Middle East & North AfricaMiddle East & North Africa (excluding high income)Middle East & North Africa (IDA & IBRD countries)Middle incomeMoldovaMongoliaMontenegroMoroccoMozambiqueMyanmarNamibiaNauruNepalNetherlandsNew ZealandNicaraguaNigerNigeriaNorth AmericaNorwayOECD membersOmanOther small statesPacific island small statesPakistanPalauPanamaPapua New GuineaParaguayPeruPhilippinesPolandPortugalPost-demographic dividendPre-demographic dividendPuerto RicoQatarRomaniaRussian FederationRwandaSamoaSan MarinoSao Tome and PrincipeSaudi ArabiaSenegalSerbiaSeychellesSierra LeoneSloveniaSmall statesSolomon IslandsSomaliaSouth AfricaSouth AsiaSouth Asia (IDA & IBRD)South SudanSpainSri LankaSt. Kitts and NevisSt. LuciaSt. Vincent and the GrenadinesSub-Saharan Africa Sub-Saharan Africa (excluding high income)Sub-Saharan Africa (IDA & IBRD countries)SudanSurinameSwazilandSwedenSwitzerlandSyrian Arab RepublicTajikistanTanzaniaThailandTimor-LesteTogoTongaTrinidad and TobagoTunisiaTurkeyTuvaluUgandaUkraineUnited Arab EmiratesUnited KingdomUnited StatesUpper middle incomeUruguayUzbekistanVanuatuVenezuela, RBVietnamWest Bank and GazaWorldYemen, Rep.ZambiaZimbabwe
Linea del tempo:
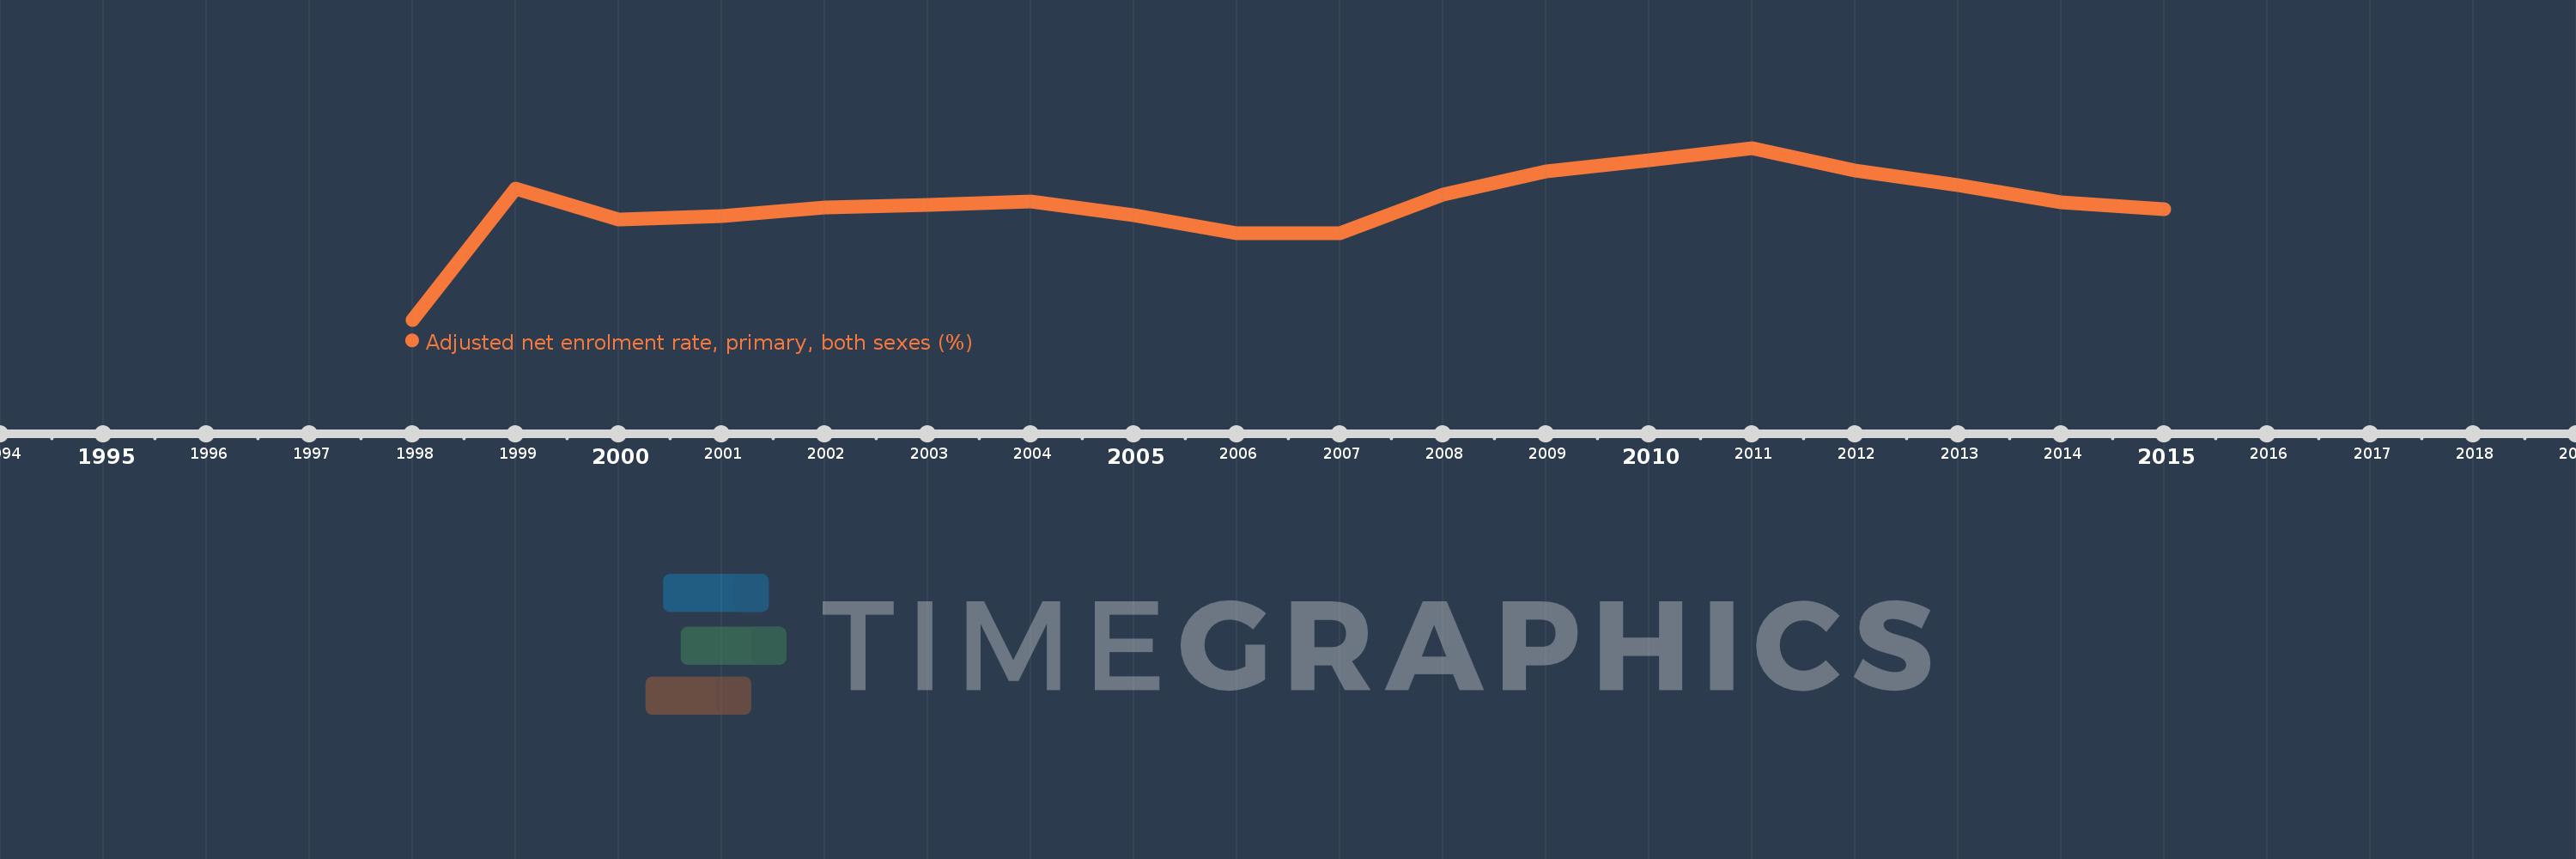
Questa scala temporale mostra un grafico dal 1998 anno al 2015 anno. Central Europe and the Baltics. I dati fino ad 1997 anno non disponibili. Il numero di osservazioni attuali secondo i date: 18.
La fonte (nome):
Indicatori dello sviluppo mondiale
La fonte (organizzazione):
UNESCO Institute for Statistics
Categorie:
Education
sono stati aggiornati
23 apr 2017 anni
Indicatori delle variazioni dei valori per anni
In media:
95.844
Minima:
93.695
1 gen 1998 anni
Massimo:
96.898
1 gen 2011 anni
Alla data di osservazione
Valore
Variazione assoluta
La variazione rispetto al valore precedente
1 gen 1998 anni
93.695
+93.695
0.0%
1 gen 1999 anni
96.147
+2.452
2.62%
1 gen 2000 anni
95.564
-0.583
-0.61%
1 gen 2001 anni
95.628
+0.064
0.07%
1 gen 2002 anni
95.795
+0.168
0.18%
1 gen 2003 anni
95.833
+0.038
0.04%
1 gen 2004 anni
95.906
+0.073
0.08%
1 gen 2005 anni
95.647
-0.259
-0.27%
1 gen 2006 anni
95.314
-0.333
-0.35%
1 gen 2007 anni
95.302
-0.013
-0.01%
1 gen 2008 anni
96.026
+0.725
0.76%
1 gen 2009 anni
96.459
+0.433
0.45%
1 gen 2010 anni
96.663
+0.204
0.21%
1 gen 2011 anni
96.898
+0.235
0.24%
1 gen 2012 anni
96.476
-0.423
-0.44%
1 gen 2013 anni
96.21
-0.265
-0.27%
1 gen 2014 anni
95.88
-0.331
-0.34%
1 gen 2015 anni
95.756
-0.123
-0.13%
Classificazione dei paesi secondo i statistiche attuali per anni

Commenti:

Inviare
PremiumAbout & FeedbackAccordoPrivatezza
logo
© 2022 Selected Technologies LLC – Morgan Hill, California