33
/it/
AIzaSyAYiBZKx7MnpbEhh9jyipgxe19OcubqV5w
August 1, 2025
252445
St. Vincent and the Grenadines
VCT
true
2
1
Revenue, excluding grants (current LCU)
1990,1989,1988,1987,1986,1985,1984,1983,1982,1981,1980,1979
Download
Biblioteca di statistiche globali →St. Vincent and the Grenadines →

Revenue, excluding grants (current LCU)

Queste statistiche in altri paesi:

AfghanistanAlbaniaAlgeriaAngolaAntigua and BarbudaArgentinaArmeniaAustraliaAustriaAzerbaijanBahamas, TheBahrainBangladeshBarbadosBelarusBelgiumBelizeBeninBhutanBoliviaBosnia and HerzegovinaBotswanaBrazilBulgariaBurkina FasoBurundiCabo VerdeCambodiaCanadaCentral African RepublicChileChinaColombiaCongo, Dem. Rep.Congo, Rep.Costa RicaCote d'IvoireCroatiaCyprusCzech RepublicDenmarkDominicaDominican RepublicEgypt, Arab Rep.El SalvadorEquatorial GuineaEstoniaEthiopiaFijiFinlandFranceGambia, TheGeorgiaGermanyGhanaGreeceGrenadaGuatemalaHondurasHong Kong SAR, ChinaHungaryIcelandIndiaIndonesiaIran, Islamic Rep.IraqIrelandIsraelItalyJamaicaJapanJordanKazakhstanKenyaKiribatiKorea, Rep.KuwaitKyrgyz RepublicLao PDRLatviaLebanonLesothoLiberiaLithuaniaLuxembourgMacao SAR, ChinaMacedonia, FYRMadagascarMalawiMalaysiaMaldivesMaliMaltaMauritiusMexicoMicronesia, Fed. Sts.MoldovaMongoliaMoroccoMozambiqueMyanmarNamibiaNepalNetherlandsNew ZealandNicaraguaNigeriaNorwayOmanPakistanPanamaPapua New GuineaParaguayPeruPhilippinesPolandPortugalQatarRomaniaRussian FederationRwandaSamoaSan MarinoSao Tome and PrincipeSenegalSerbiaSeychellesSierra LeoneSingaporeSlovak RepublicSloveniaSolomon IslandsSouth AfricaSpainSri LankaSt. Kitts and NevisSt. LuciaSt. Vincent and the GrenadinesSurinameSwazilandSwedenSwitzerlandSyrian Arab RepublicTajikistanTanzaniaThailandTimor-LesteTogoTrinidad and TobagoTunisiaTurkeyUgandaUkraineUnited Arab EmiratesUnited KingdomUnited StatesUruguayVanuatuVenezuela, RBVietnamWest Bank and GazaYemen, Rep.ZambiaZimbabwe

Linea del tempo:

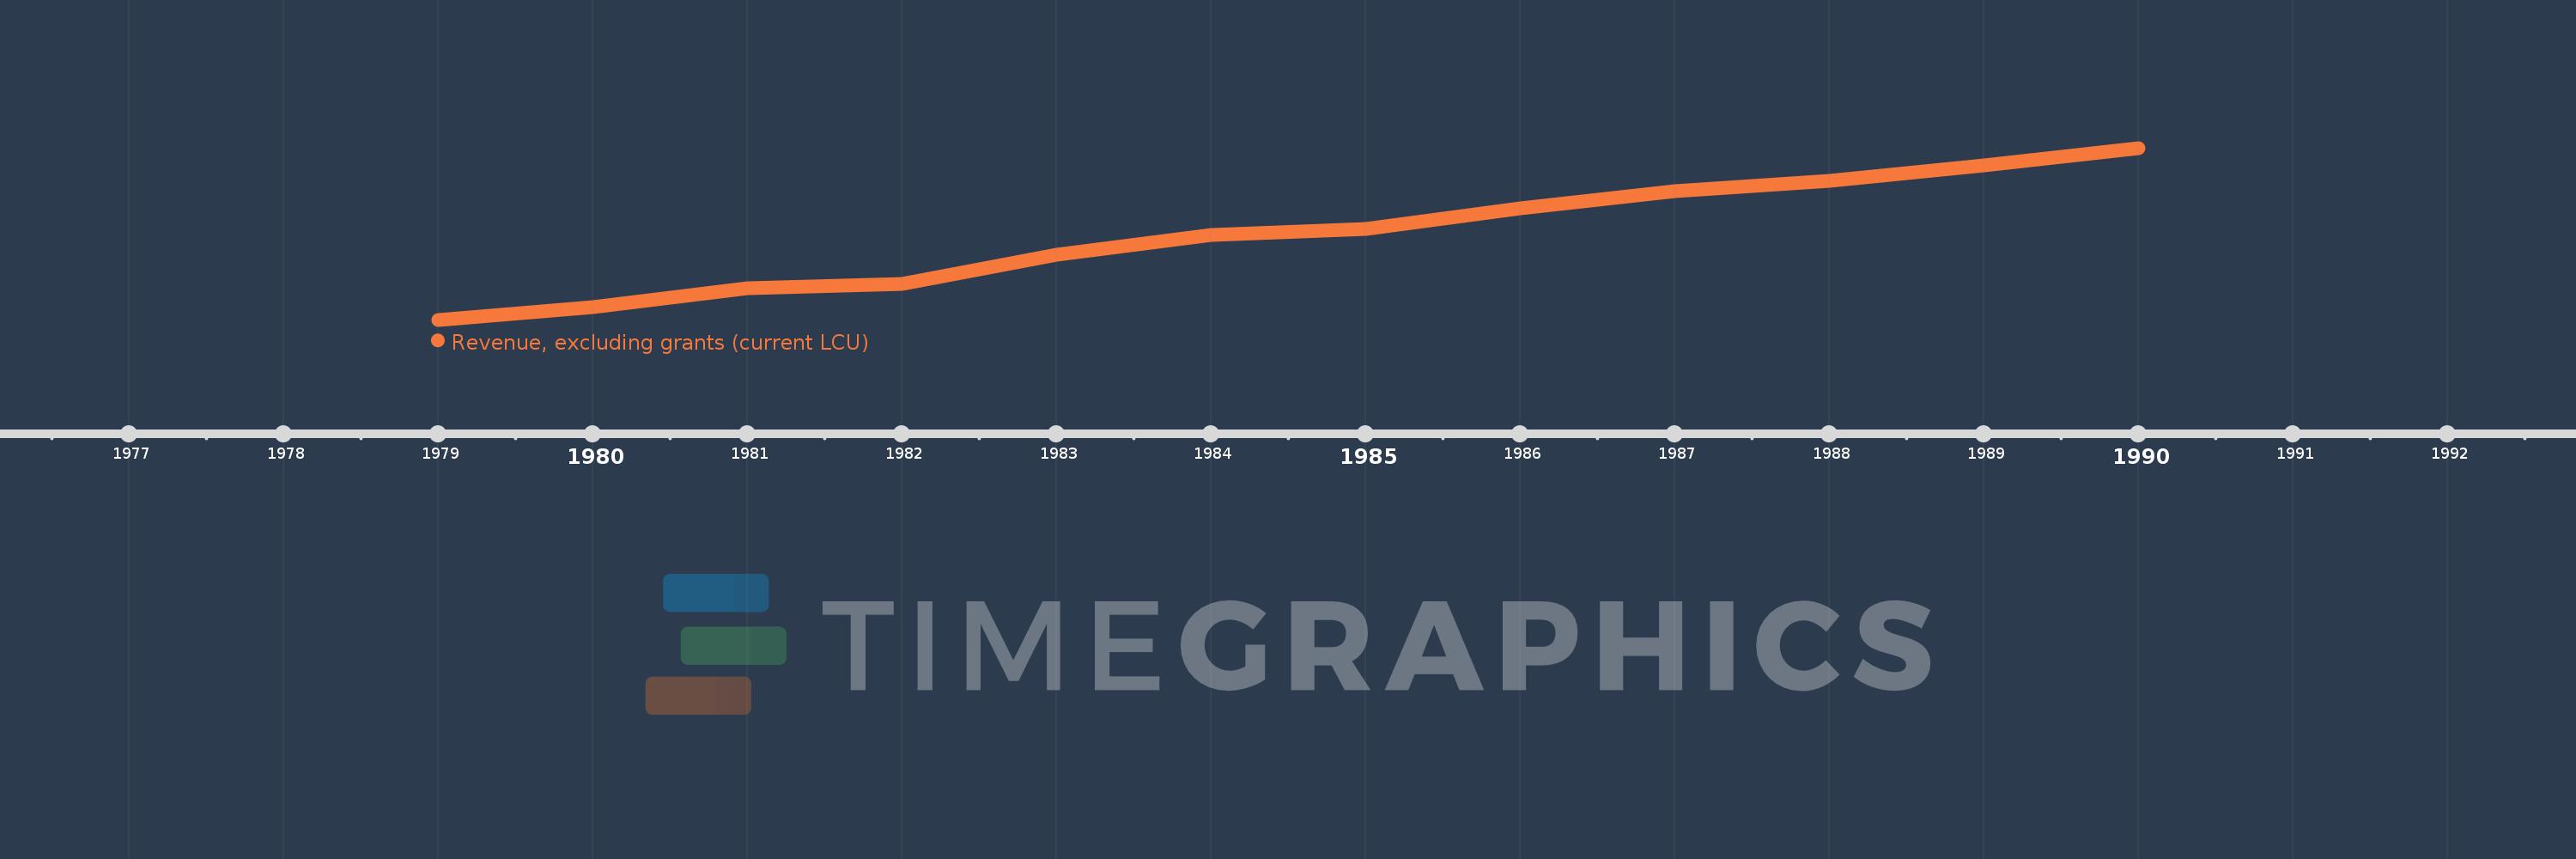
Questa scala temporale mostra un grafico dal 1979 anno al 1990 anno. St. Vincent and the Grenadines. I dati fino ad 1978 anno non disponibili. Il numero di osservazioni attuali secondo i date: 12.

La fonte (nome):

Indicatori dello sviluppo mondiale

La fonte (organizzazione):

International Monetary Fund, Government Finance Statistics Yearbook and data files.

Categorie:

Public Sector

sono stati aggiornati

23 apr 2017 anni

Indicatori delle variazioni dei valori per anni

In media:
75.283 Mln
Minima:
24.5 Mln
1 gen 1979 anni
Massimo:
126.6 Mln
1 gen 1990 anni
Alla data di osservazione
Valore
Variazione assoluta
La variazione rispetto al valore precedente
1 gen 1979 anni
24.5 Mln
+24.5 Mln
0.0%
1 gen 1980 anni
31.8 Mln
+7.3 Mln
29.8%
1 gen 1981 anni
43.2 Mln
+11.4 Mln
35.85%
1 gen 1982 anni
45.9 Mln
+2.7 Mln
6.25%
1 gen 1983 anni
62.9 Mln
+17.0 Mln
37.04%
1 gen 1984 anni
74.9 Mln
+12.0 Mln
19.08%
1 gen 1985 anni
78.6 Mln
+3.7 Mln
4.94%
1 gen 1986 anni
90.7 Mln
+12.1 Mln
15.39%
1 gen 1987 anni
100.7 Mln
+10.0 Mln
11.03%
1 gen 1988 anni
107.3 Mln
+6.6 Mln
6.55%
1 gen 1989 anni
116.3 Mln
+9.0 Mln
8.39%
1 gen 1990 anni
126.6 Mln
+10.3 Mln
8.86%

Classificazione dei paesi secondo i statistiche attuali per anni