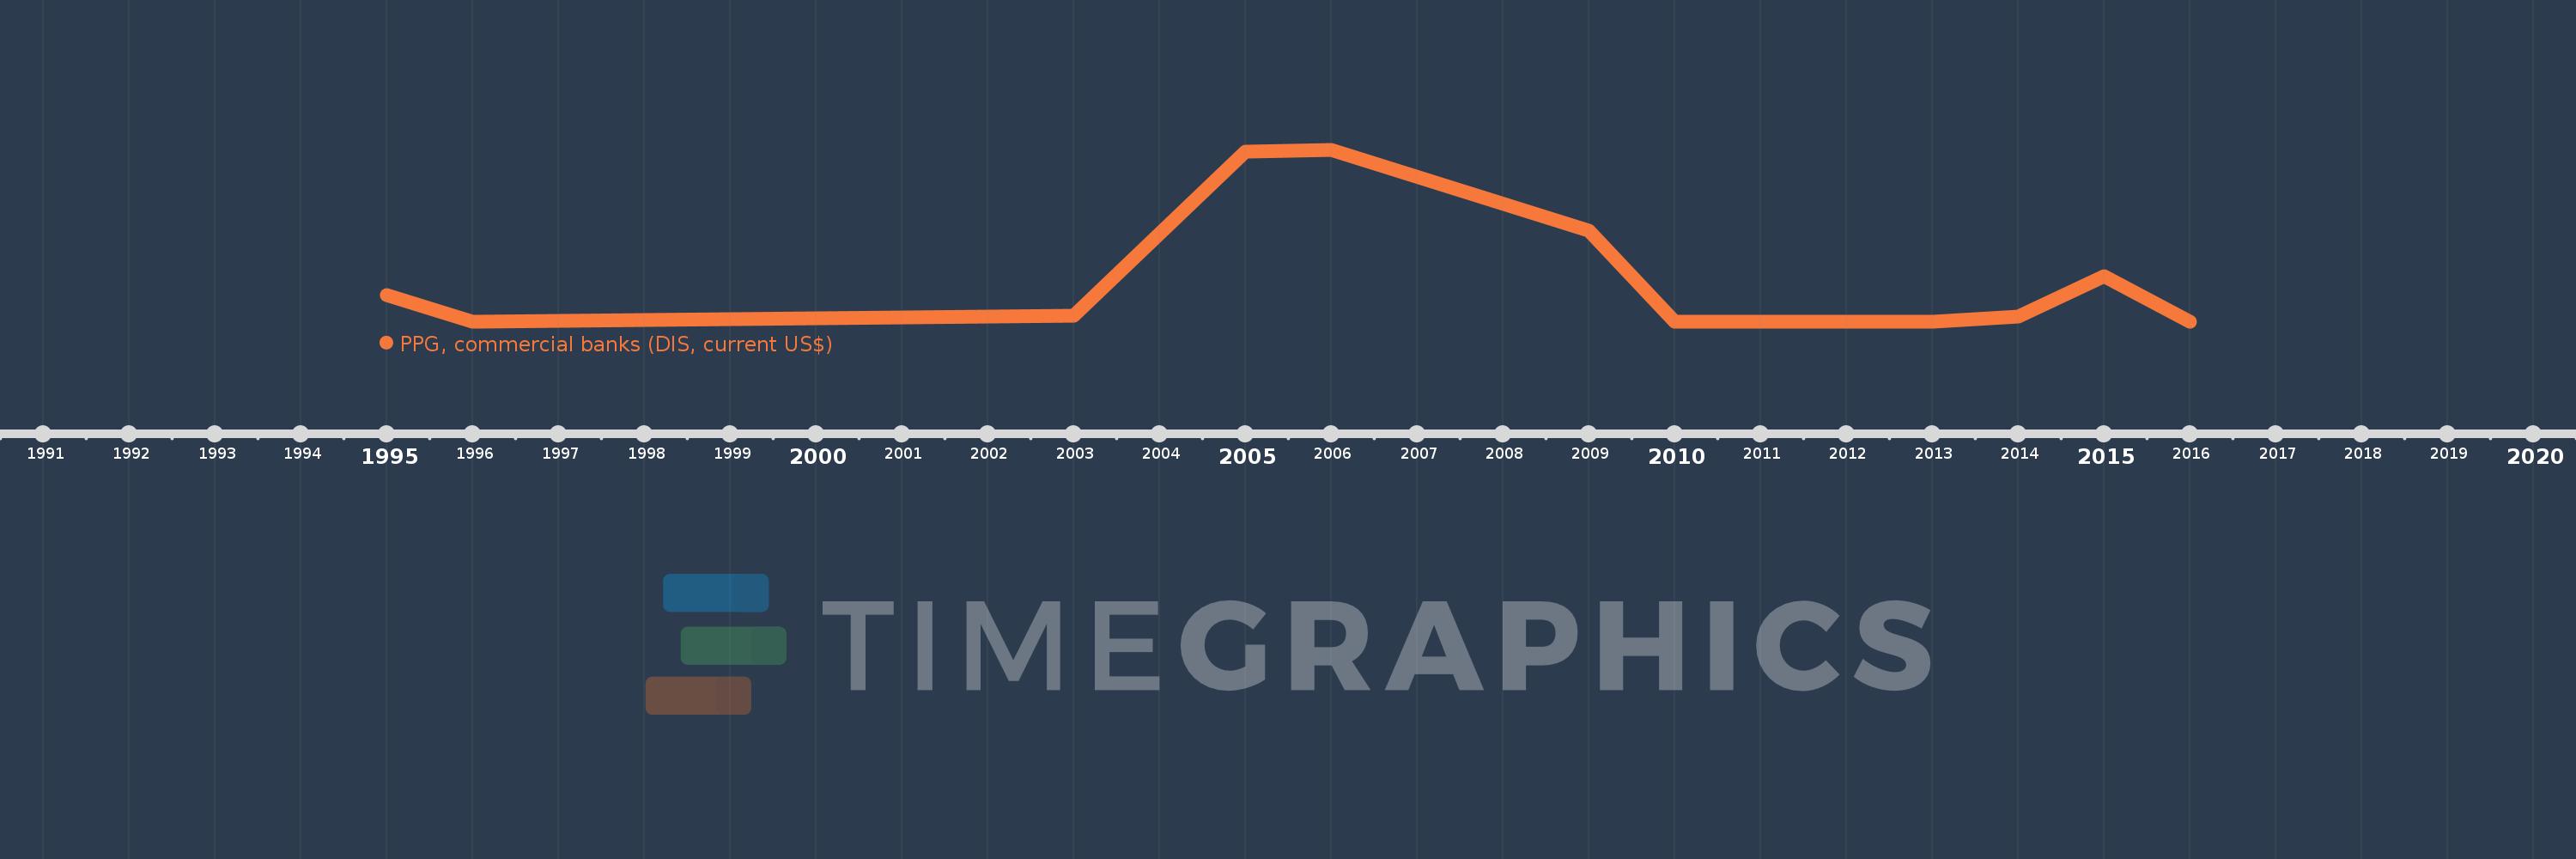
Questa scala temporale mostra un grafico dal 1995 anno al 2016 anno. St. Vincent and the Grenadines. I dati fino ad 1994 anno non disponibili. Il numero di osservazioni attuali secondo i date: 13.
La fonte (nome):
Indicatori dello sviluppo mondiale
La fonte (organizzazione):
World Bank, International Debt Statistics.
Categorie:
External Debt
sono stati aggiornati
23 apr 2017 anni
Indicatori delle variazioni dei valori per anni
In media:
6.971 Mln
Minima:
0.0
1 gen 2010 anni
Massimo:
30.0 Mln
1 gen 2006 anni
Alla data di osservazione
Valore
Variazione assoluta
La variazione rispetto al valore precedente
1 gen 1995 anni
4.749 Mln
+4.749 Mln
0.0%
1 gen 1996 anni
51.0 Mille.
-4.698 Mln
-98.93%
1 gen 2003 anni
1.08 Mln
+1.029 Mln
2.02 Mille.%
1 gen 2005 anni
29.815 Mln
+28.735 Mln
2.66 Mille.%
1 gen 2006 anni
30.0 Mln
+185.0 Mille.
0.62%
1 gen 2009 anni
16.0 Mln
-14.0 Mln
-46.67%
1 gen 2010 anni
0.0
-16.0 Mln
-100.0%
1 gen 2011 anni
0.0
0.0
%
1 gen 2012 anni
0.0
0.0
%
1 gen 2013 anni
0.0
0.0
%
1 gen 2014 anni
970.0 Mille.
+970.0 Mille.
%
1 gen 2015 anni
7.962 Mln
+6.992 Mln
720.82%
1 gen 2016 anni
0.0
-7.962 Mln
-100.0%
Classificazione dei paesi secondo i statistiche attuali per anni