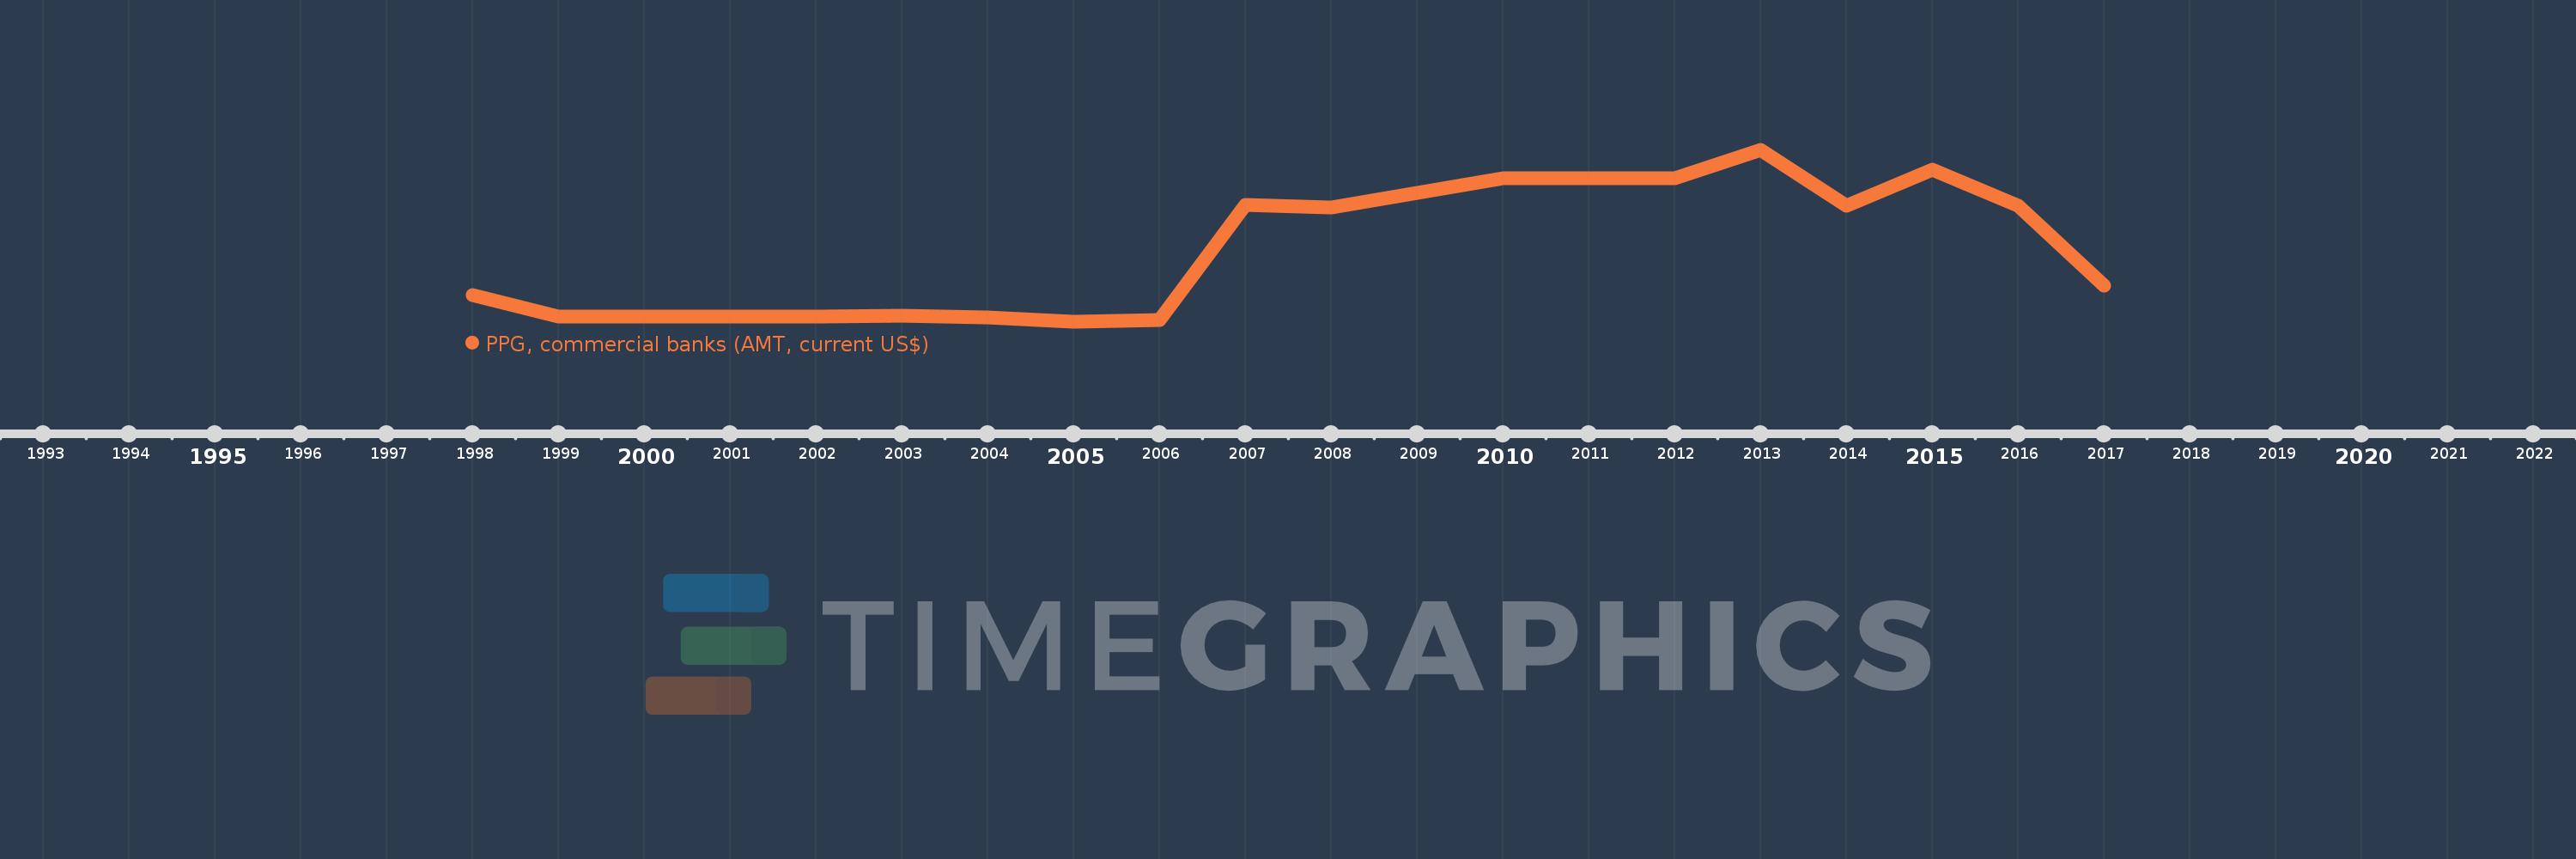
Questa scala temporale mostra un grafico dal 1998 anno al 2017 anno. St. Vincent and the Grenadines. I dati fino ad 1997 anno non disponibili. Il numero di osservazioni attuali secondo i date: 20.
La fonte (nome):
Indicatori dello sviluppo mondiale
La fonte (organizzazione):
World Bank, International Debt Statistics.
Categorie:
External Debt
sono stati aggiornati
23 apr 2017 anni
Indicatori delle variazioni dei valori per anni
In media:
4.028 Mln
Minima:
120.0 Mille.
1 gen 2005 anni
Massimo:
9.413 Mln
1 gen 2013 anni
Alla data di osservazione
Valore
Variazione assoluta
La variazione rispetto al valore precedente
1 gen 1998 anni
1.56 Mln
+1.56 Mln
0.0%
1 gen 1999 anni
400.0 Mille.
-1.16 Mln
-74.36%
1 gen 2000 anni
400.0 Mille.
0.0
0.0%
1 gen 2001 anni
400.0 Mille.
0.0
0.0%
1 gen 2002 anni
400.0 Mille.
0.0
0.0%
1 gen 2003 anni
440.0 Mille.
+40.0 Mille.
10.0%
1 gen 2004 anni
360.0 Mille.
-80.0 Mille.
-18.18%
1 gen 2005 anni
120.0 Mille.
-240.0 Mille.
-66.67%
1 gen 2006 anni
240.0 Mille.
+120.0 Mille.
100.0%
1 gen 2007 anni
6.433 Mln
+6.193 Mln
2.58 Mille.%
1 gen 2008 anni
6.312 Mln
-121.0 Mille.
-1.88%
1 gen 2009 anni
7.113 Mln
+801.0 Mille.
12.69%
1 gen 2010 anni
7.913 Mln
+800.0 Mille.
11.25%
1 gen 2011 anni
7.913 Mln
0.0
0.0%
1 gen 2012 anni
7.913 Mln
0.0
0.0%
1 gen 2013 anni
9.413 Mln
+1.5 Mln
18.96%
1 gen 2014 anni
6.413 Mln
-3.0 Mln
-31.87%
1 gen 2015 anni
8.36 Mln
+1.947 Mln
30.36%
1 gen 2016 anni
6.387 Mln
-1.973 Mln
-23.6%
1 gen 2017 anni
2.068 Mln
-4.319 Mln
-67.62%
Classificazione dei paesi secondo i statistiche attuali per anni