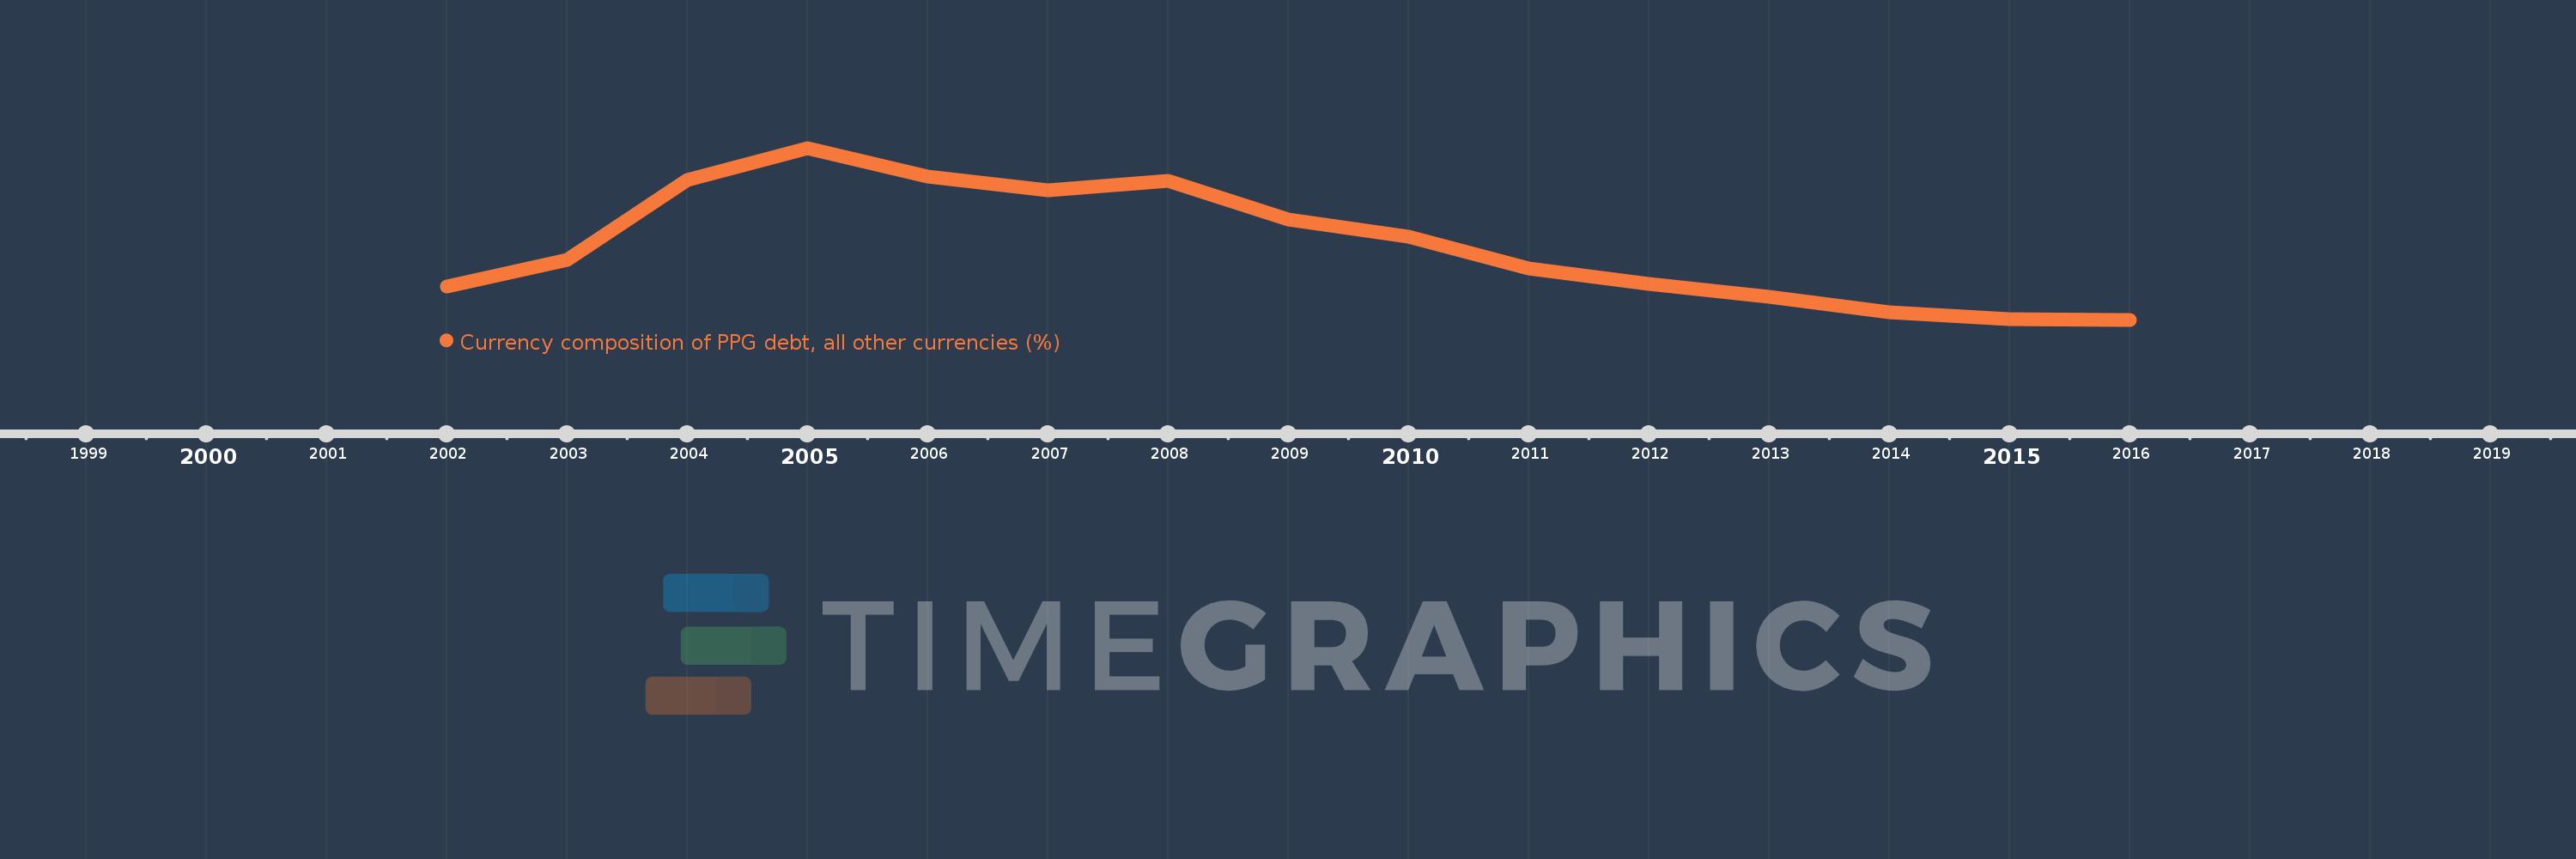
Questa scala temporale mostra un grafico dal 2002 anno al 2016 anno. St. Vincent and the Grenadines. I dati fino ad 2001 anno non disponibili. Il numero di osservazioni attuali secondo i date: 15.
La fonte (nome):
Indicatori dello sviluppo mondiale
La fonte (organizzazione):
World Bank, International Debt Statistics.
Categorie:
External Debt
sono stati aggiornati
23 apr 2017 anni
Indicatori delle variazioni dei valori per anni
In media:
10.756
Minima:
1.2
1 gen 2016 anni
Massimo:
23.251
1 gen 2005 anni
Alla data di osservazione
Valore
Variazione assoluta
La variazione rispetto al valore precedente
1 gen 2002 anni
5.49
+5.49
0.0%
1 gen 2003 anni
8.883
+3.392
61.78%
1 gen 2004 anni
19.094
+10.211
114.95%
1 gen 2005 anni
23.251
+4.158
21.77%
1 gen 2006 anni
19.542
-3.709
-15.95%
1 gen 2007 anni
17.797
-1.745
-8.93%
1 gen 2008 anni
19.06
+1.263
7.09%
1 gen 2009 anni
14.016
-5.044
-26.46%
1 gen 2010 anni
11.903
-2.113
-15.07%
1 gen 2011 anni
7.757
-4.146
-34.83%
1 gen 2012 anni
5.764
-1.993
-25.69%
1 gen 2013 anni
4.114
-1.651
-28.64%
1 gen 2014 anni
2.17
-1.944
-47.25%
1 gen 2015 anni
1.304
-0.866
-39.92%
1 gen 2016 anni
1.2
-0.104
-7.99%
Classificazione dei paesi secondo i statistiche attuali per anni