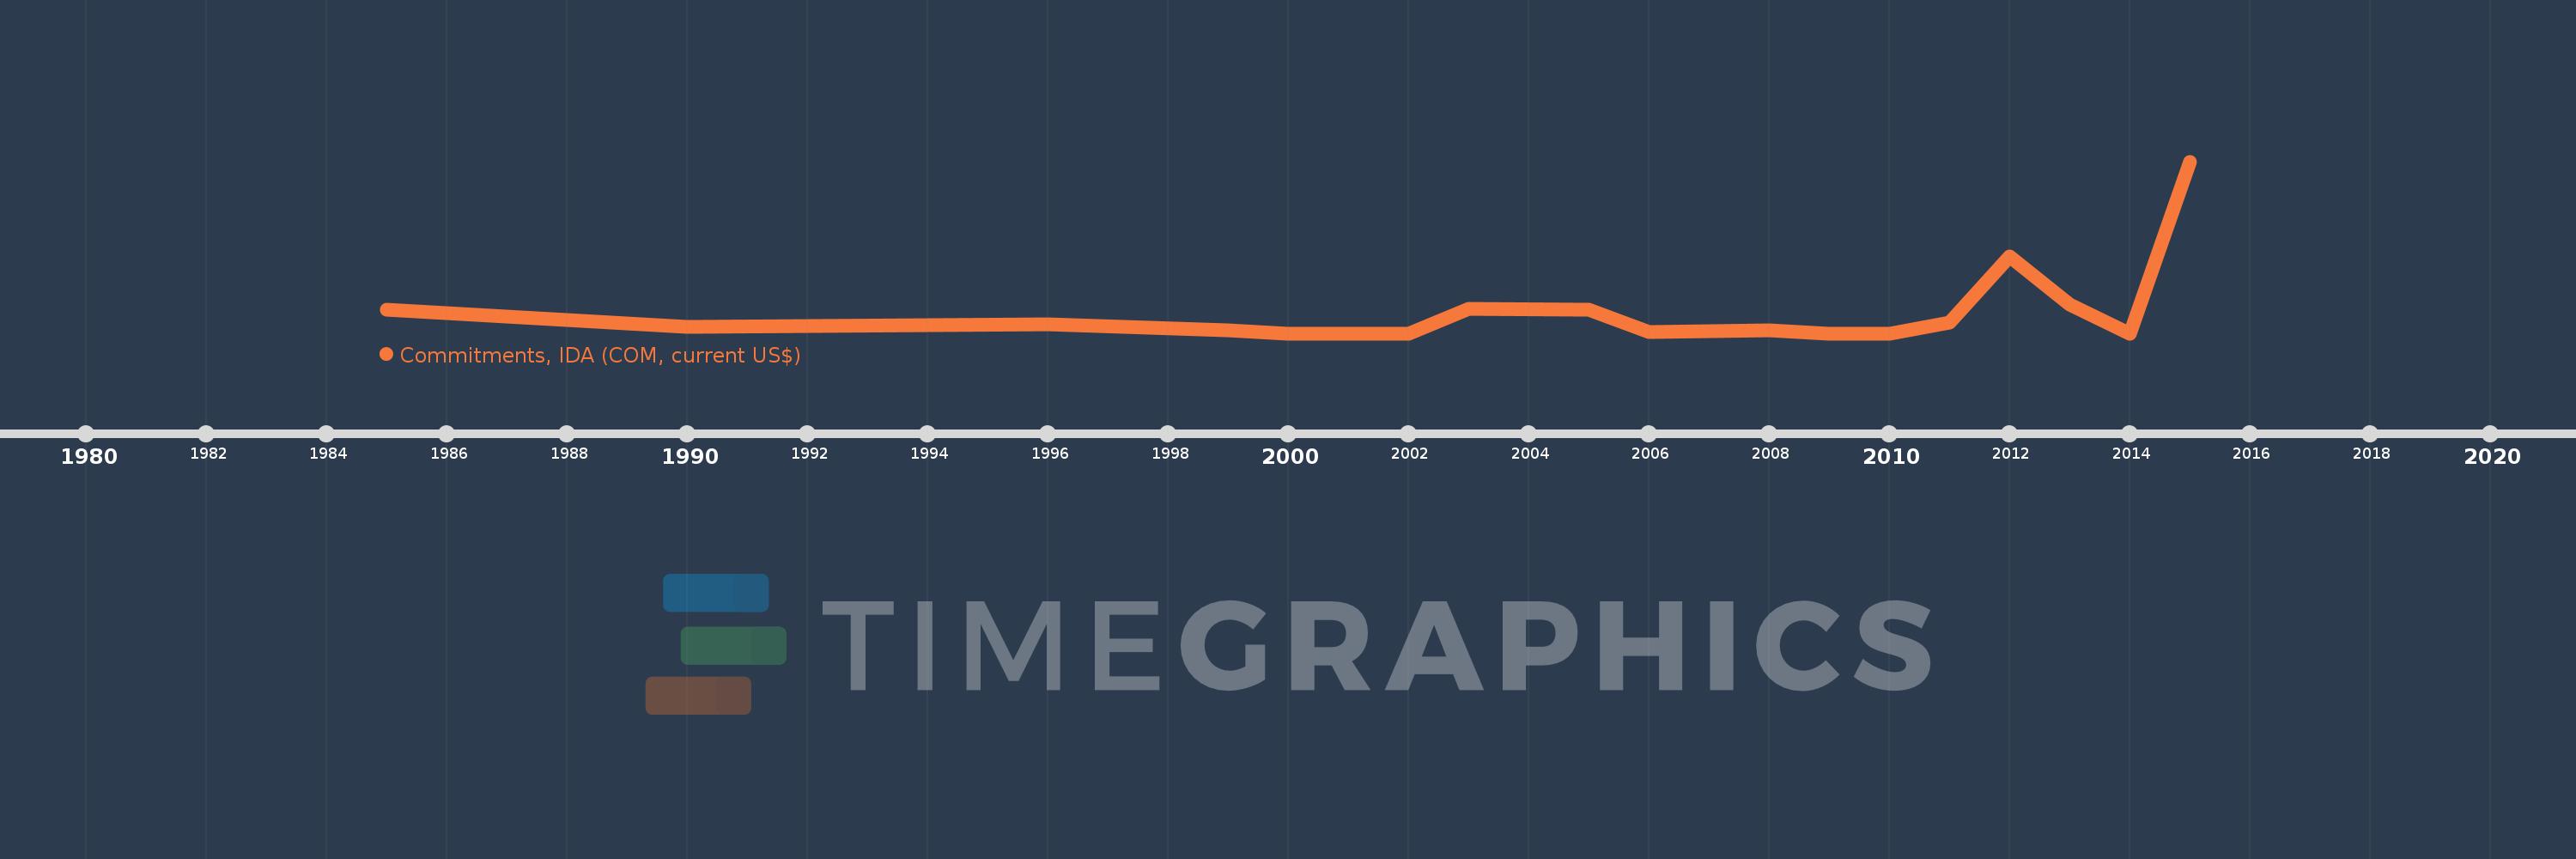
Questa scala temporale mostra un grafico dal 1985 anno al 2015 anno. St. Vincent and the Grenadines. I dati fino ad 1984 anno non disponibili. Il numero di osservazioni attuali secondo i date: 17.
La fonte (nome):
Indicatori dello sviluppo mondiale
La fonte (organizzazione):
World Bank, International Debt Statistics.
Categorie:
External Debt
sono stati aggiornati
23 apr 2017 anni
Indicatori delle variazioni dei valori per anni
In media:
4.672 Mln
Minima:
0.0
1 gen 2000 anni
Massimo:
35.6 Mln
1 gen 2015 anni
Alla data di osservazione
Valore
Variazione assoluta
La variazione rispetto al valore precedente
1 gen 1985 anni
4.819 Mln
+4.819 Mln
0.0%
1 gen 1990 anni
1.41 Mln
-3.409 Mln
-70.74%
1 gen 1996 anni
1.8 Mln
+390.0 Mille.
27.66%
1 gen 1999 anni
600.0 Mille.
-1.2 Mln
-66.67%
1 gen 2000 anni
0.0
-600.0 Mille.
-100.0%
1 gen 2002 anni
0.0
0.0
%
1 gen 2003 anni
5.15 Mln
+5.15 Mln
%
1 gen 2005 anni
4.85 Mln
-300.0 Mille.
-5.83%
1 gen 2006 anni
271.0 Mille.
-4.579 Mln
-94.41%
1 gen 2008 anni
700.0 Mille.
+429.0 Mille.
158.3%
1 gen 2009 anni
0.0
-700.0 Mille.
-100.0%
1 gen 2010 anni
0.0
0.0
%
1 gen 2011 anni
2.3 Mln
+2.3 Mln
%
1 gen 2012 anni
15.92 Mln
+13.62 Mln
592.17%
1 gen 2013 anni
6.0 Mln
-9.92 Mln
-62.31%
1 gen 2014 anni
0.0
-6.0 Mln
-100.0%
1 gen 2015 anni
35.6 Mln
+35.6 Mln
%
Classificazione dei paesi secondo i statistiche attuali per anni