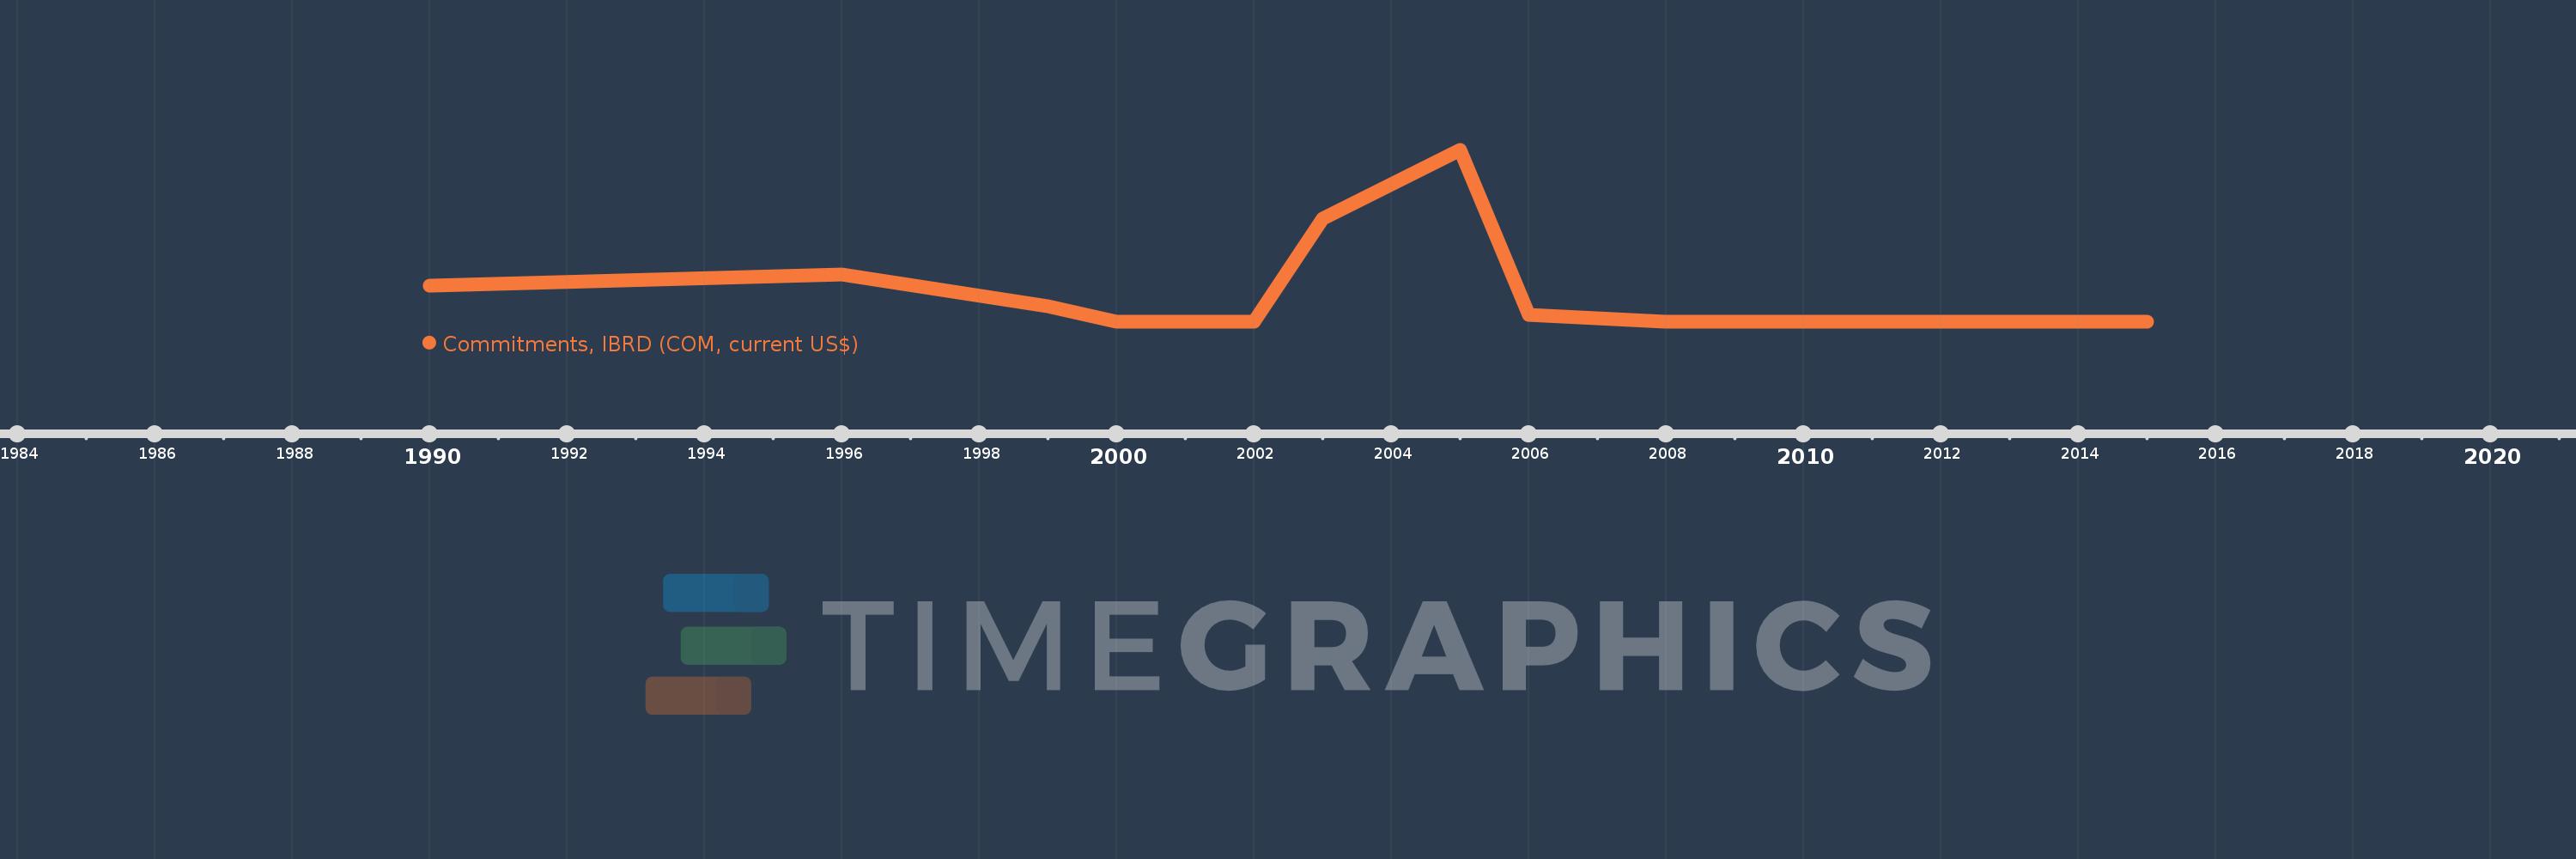
Questa scala temporale mostra un grafico dal 1990 anno al 2015 anno. St. Vincent and the Grenadines. I dati fino ad 1989 anno non disponibili. Il numero di osservazioni attuali secondo i date: 15.
La fonte (nome):
Indicatori dello sviluppo mondiale
La fonte (organizzazione):
World Bank, International Debt Statistics.
Categorie:
External Debt
sono stati aggiornati
23 apr 2017 anni
Indicatori delle variazioni dei valori per anni
In media:
976.133 Mille.
Minima:
0.0
1 gen 2000 anni
Massimo:
6.6 Mln
1 gen 2005 anni
Alla data di osservazione
Valore
Variazione assoluta
La variazione rispetto al valore precedente
1 gen 1990 anni
1.4 Mln
+1.4 Mln
0.0%
1 gen 1996 anni
1.81 Mln
+410.0 Mille.
29.29%
1 gen 1999 anni
600.0 Mille.
-1.21 Mln
-66.85%
1 gen 2000 anni
0.0
-600.0 Mille.
-100.0%
1 gen 2002 anni
0.0
0.0
%
1 gen 2003 anni
3.96 Mln
+3.96 Mln
%
1 gen 2005 anni
6.6 Mln
+2.64 Mln
66.67%
1 gen 2006 anni
272.0 Mille.
-6.328 Mln
-95.88%
1 gen 2008 anni
0.0
-272.0 Mille.
-100.0%
1 gen 2009 anni
0.0
0.0
%
1 gen 2010 anni
0.0
0.0
%
1 gen 2011 anni
0.0
0.0
%
1 gen 2013 anni
0.0
0.0
%
1 gen 2014 anni
0.0
0.0
%
1 gen 2015 anni
0.0
0.0
%
Classificazione dei paesi secondo i statistiche attuali per anni