33
/it/
AIzaSyB4mHJ5NPEv-XzF7P6NDYXjlkCWaeKw5bc
November 30, 2025
251618
St. Vincent and the Grenadines
VCT
true
2
1
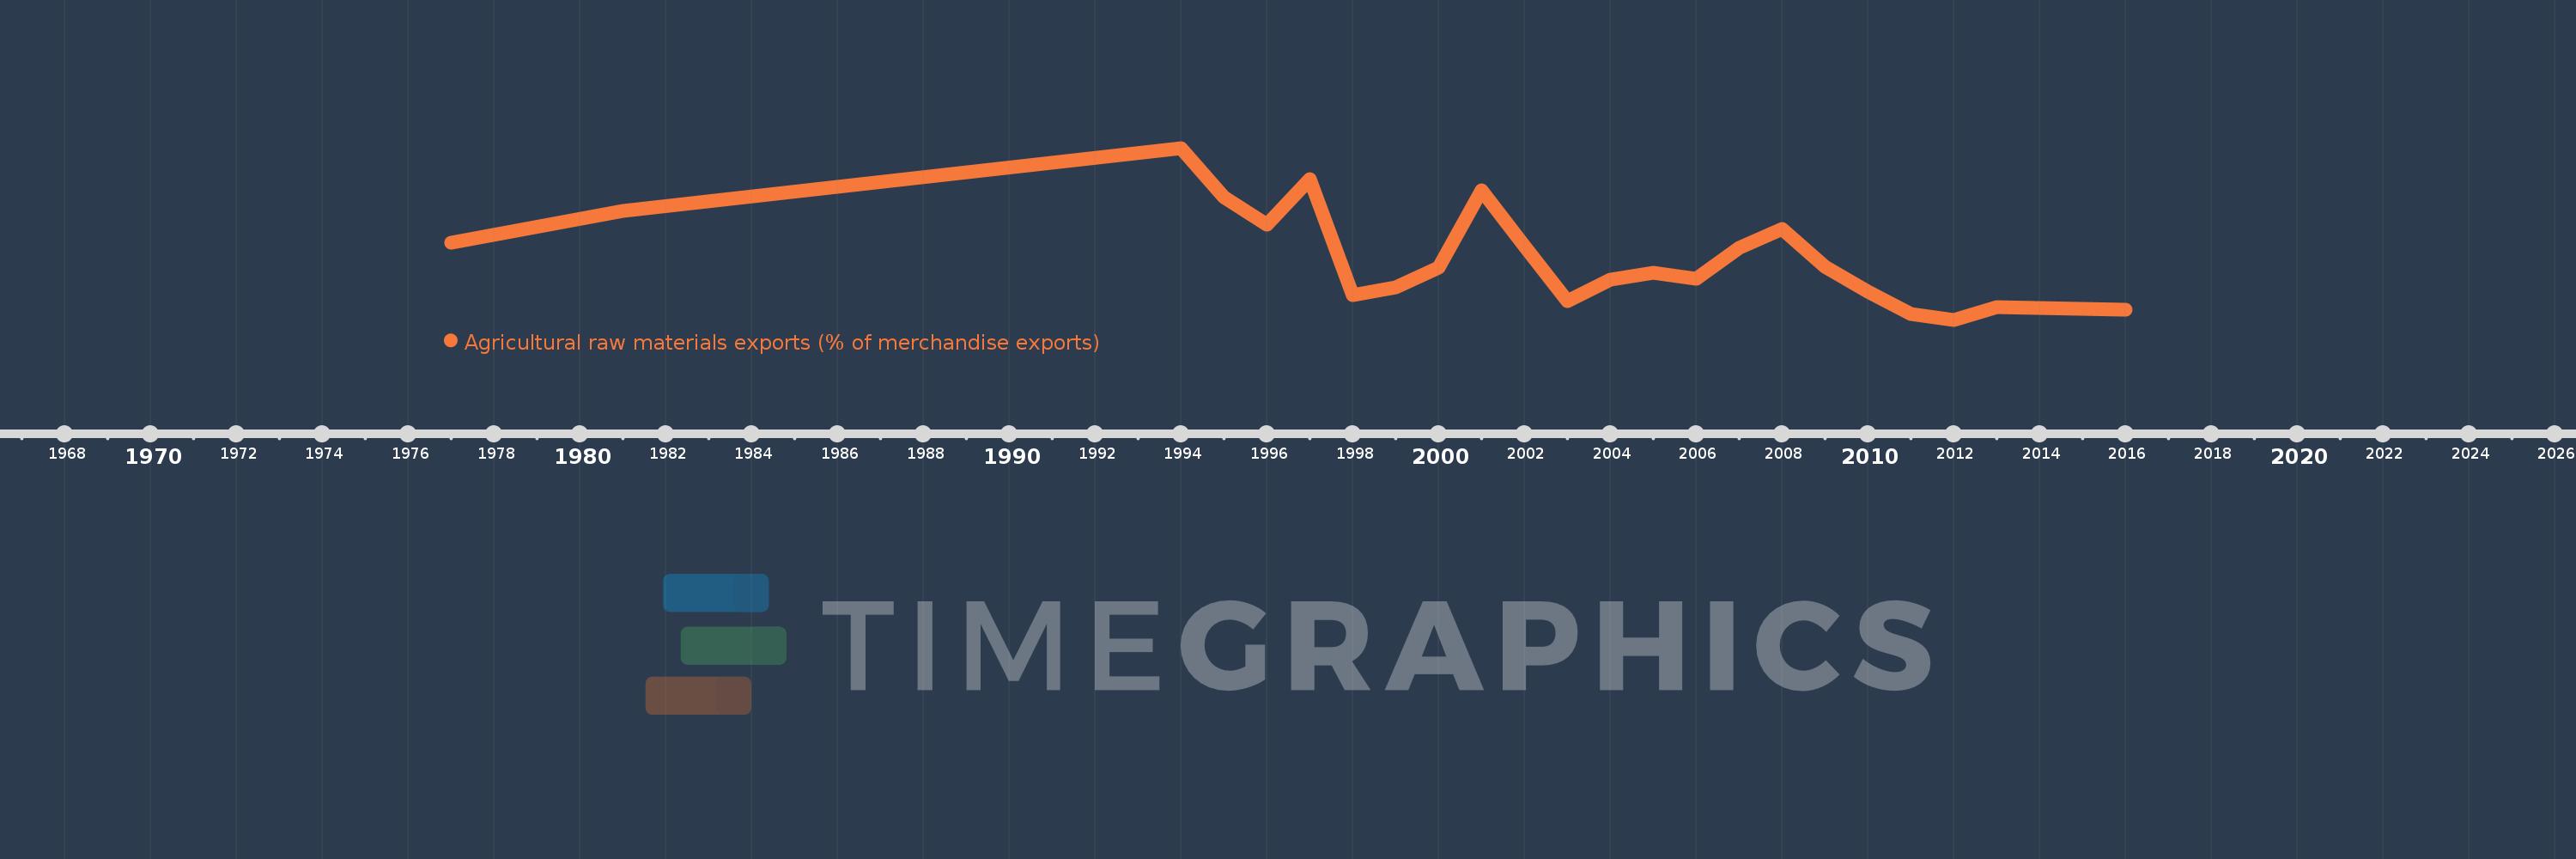
Agricultural raw materials exports (% of merchandise exports)
2016,2013,2012,2011,2010,2009,2008,2007,2006,2005,2004,2003,2002,2001,2000,1999,1998,1997,1996,1995,1994,1981,1977