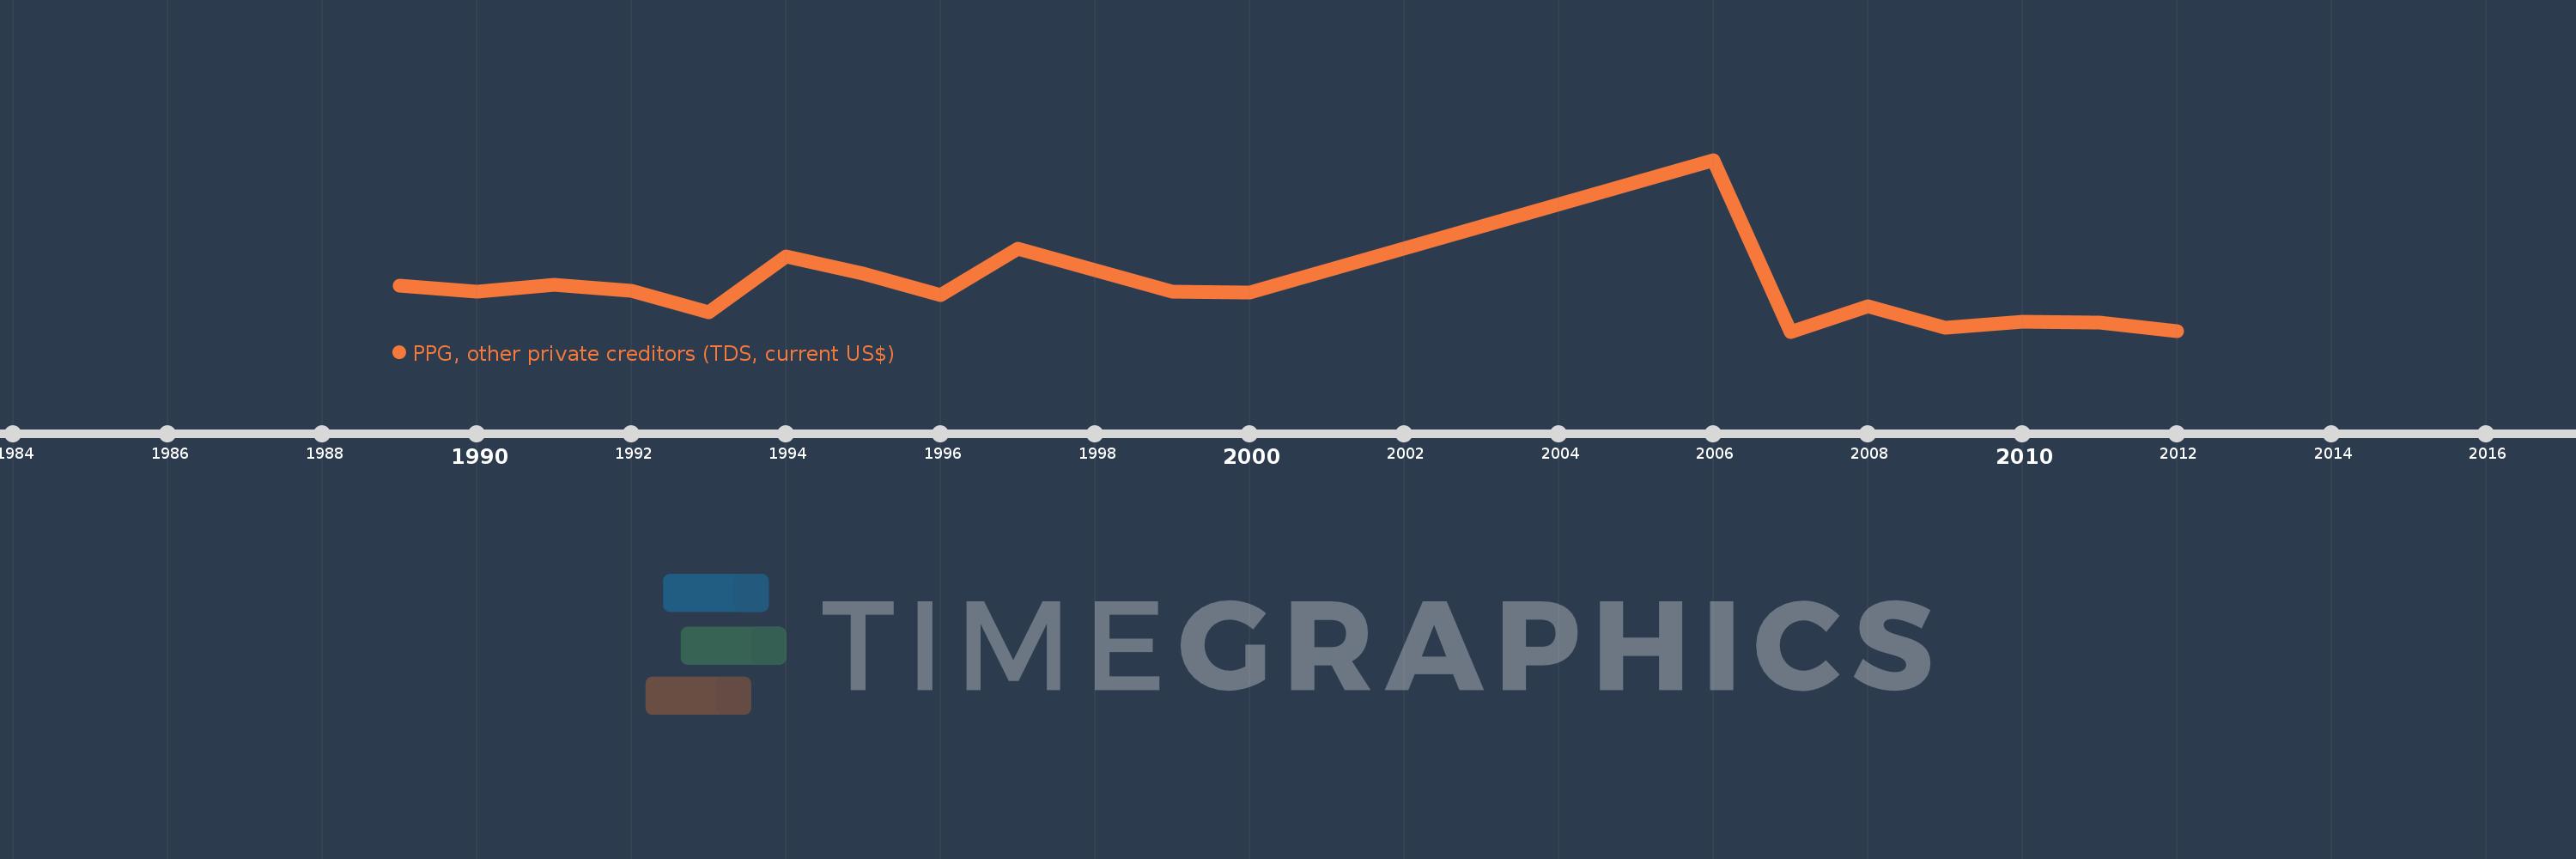
Questa scala temporale mostra un grafico dal 1989 anno al 2012 anno. Solomon Islands. I dati fino ad 1988 anno non disponibili. Il numero di osservazioni attuali secondo i date: 18.
La fonte (nome):
Indicatori dello sviluppo mondiale
La fonte (organizzazione):
World Bank, International Debt Statistics.
Categorie:
External Debt
sono stati aggiornati
23 apr 2017 anni
Indicatori delle variazioni dei valori per anni
In media:
659.611 Mille.
Minima:
56.0 Mille.
1 gen 2007 anni
Massimo:
2.564 Mln
1 gen 2006 anni
Alla data di osservazione
Valore
Variazione assoluta
La variazione rispetto al valore precedente
1 gen 1989 anni
721.0 Mille.
+721.0 Mille.
0.0%
1 gen 1990 anni
637.0 Mille.
-84.0 Mille.
-11.65%
1 gen 1991 anni
736.0 Mille.
+99.0 Mille.
15.54%
1 gen 1992 anni
649.0 Mille.
-87.0 Mille.
-11.82%
1 gen 1993 anni
341.0 Mille.
-308.0 Mille.
-47.46%
1 gen 1994 anni
1.157 Mln
+816.0 Mille.
239.3%
1 gen 1995 anni
907.0 Mille.
-250.0 Mille.
-21.61%
1 gen 1996 anni
583.0 Mille.
-324.0 Mille.
-35.72%
1 gen 1997 anni
1.263 Mln
+680.0 Mille.
116.64%
1 gen 1999 anni
641.0 Mille.
-622.0 Mille.
-49.25%
1 gen 2000 anni
630.0 Mille.
-11.0 Mille.
-1.72%
1 gen 2006 anni
2.564 Mln
+1.934 Mln
306.98%
1 gen 2007 anni
56.0 Mille.
-2.508 Mln
-97.82%
1 gen 2008 anni
427.0 Mille.
+371.0 Mille.
662.5%
1 gen 2009 anni
116.0 Mille.
-311.0 Mille.
-72.83%
1 gen 2010 anni
196.0 Mille.
+80.0 Mille.
68.97%
1 gen 2011 anni
190.0 Mille.
-6.0 Mille.
-3.06%
1 gen 2012 anni
59.0 Mille.
-131.0 Mille.
-68.95%
Classificazione dei paesi secondo i statistiche attuali per anni