33
/it/
AIzaSyB4mHJ5NPEv-XzF7P6NDYXjlkCWaeKw5bc
November 30, 2025
24098
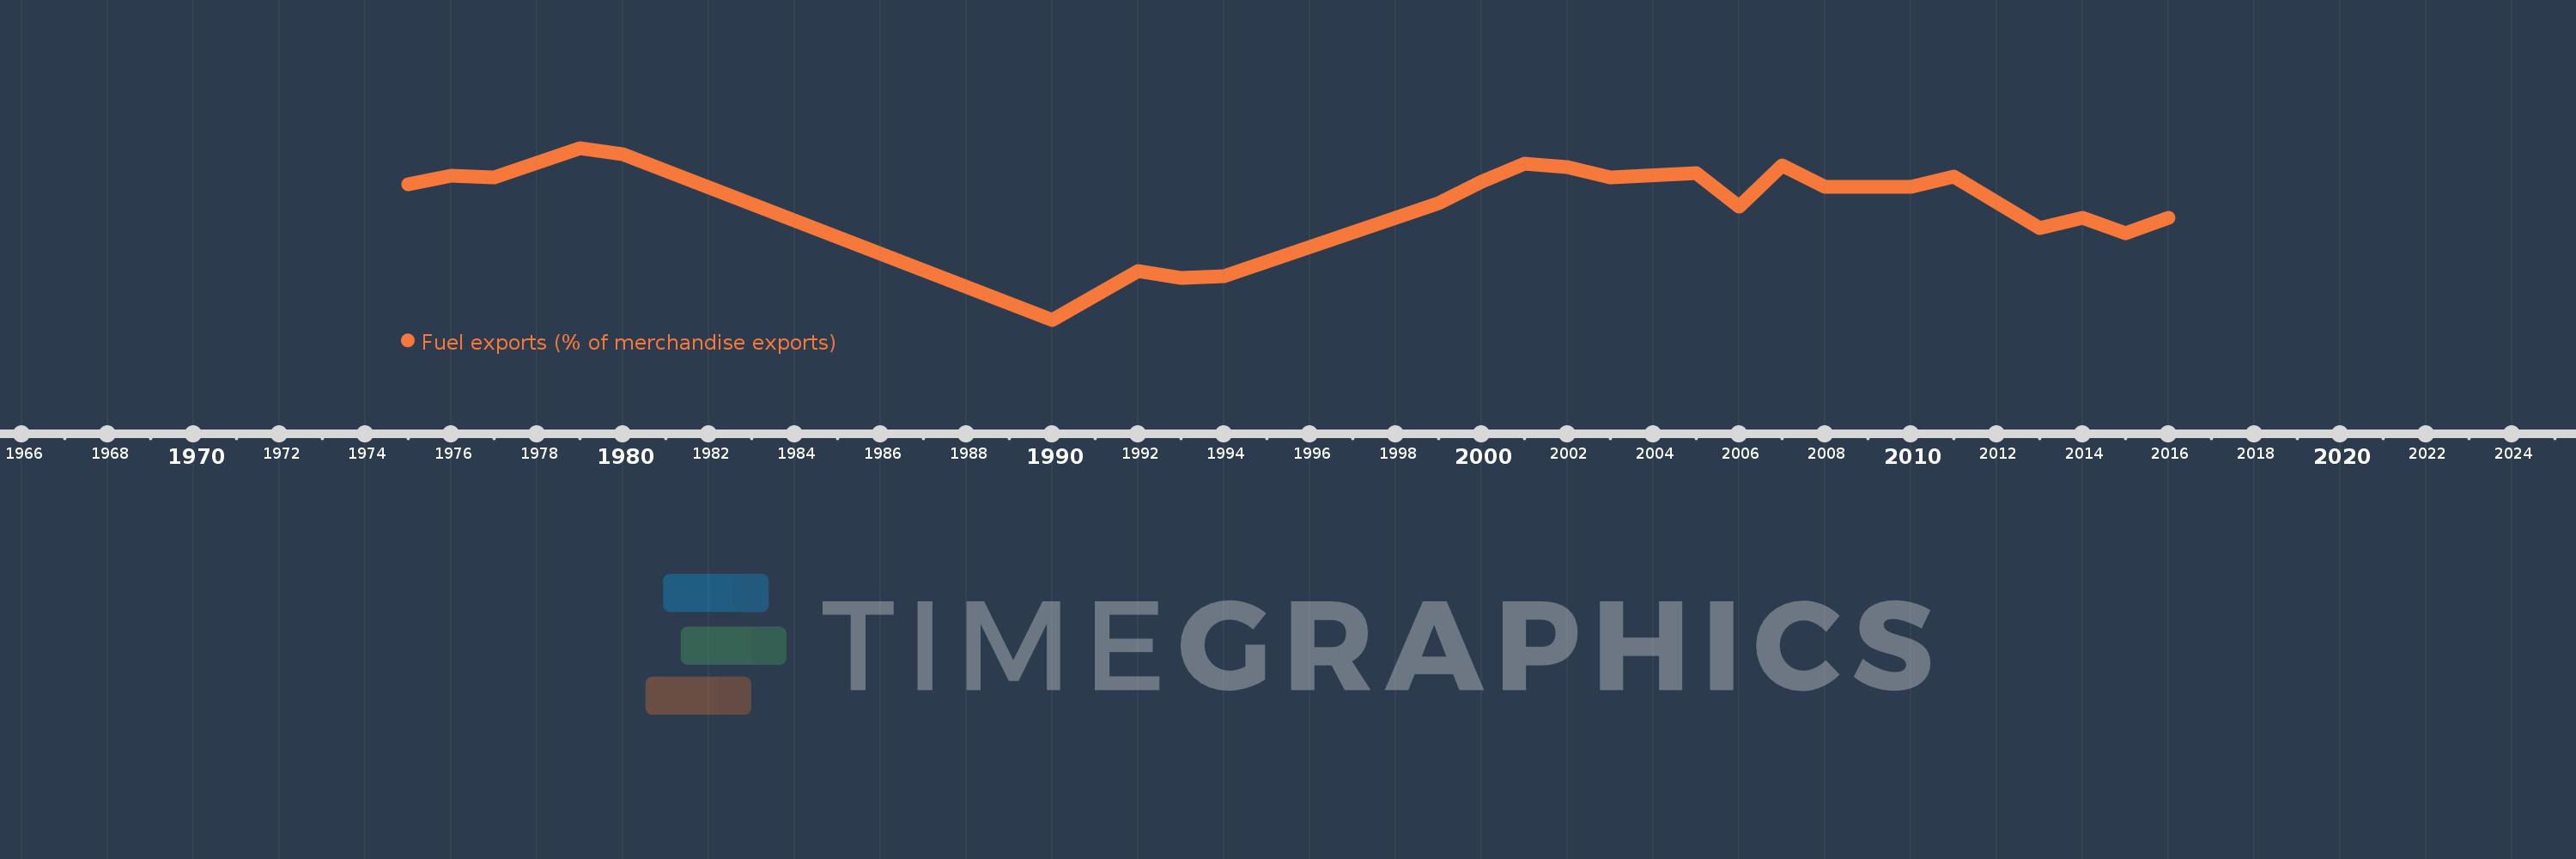
Arab World
ARB
false
2
1
Fuel exports (% of merchandise exports)
2016,2015,2014,2013,2011,2010,2009,2008,2007,2006,2005,2003,2002,2001,2000,1999,1994,1993,1992,1990,1980,1979,1977,1976,1975