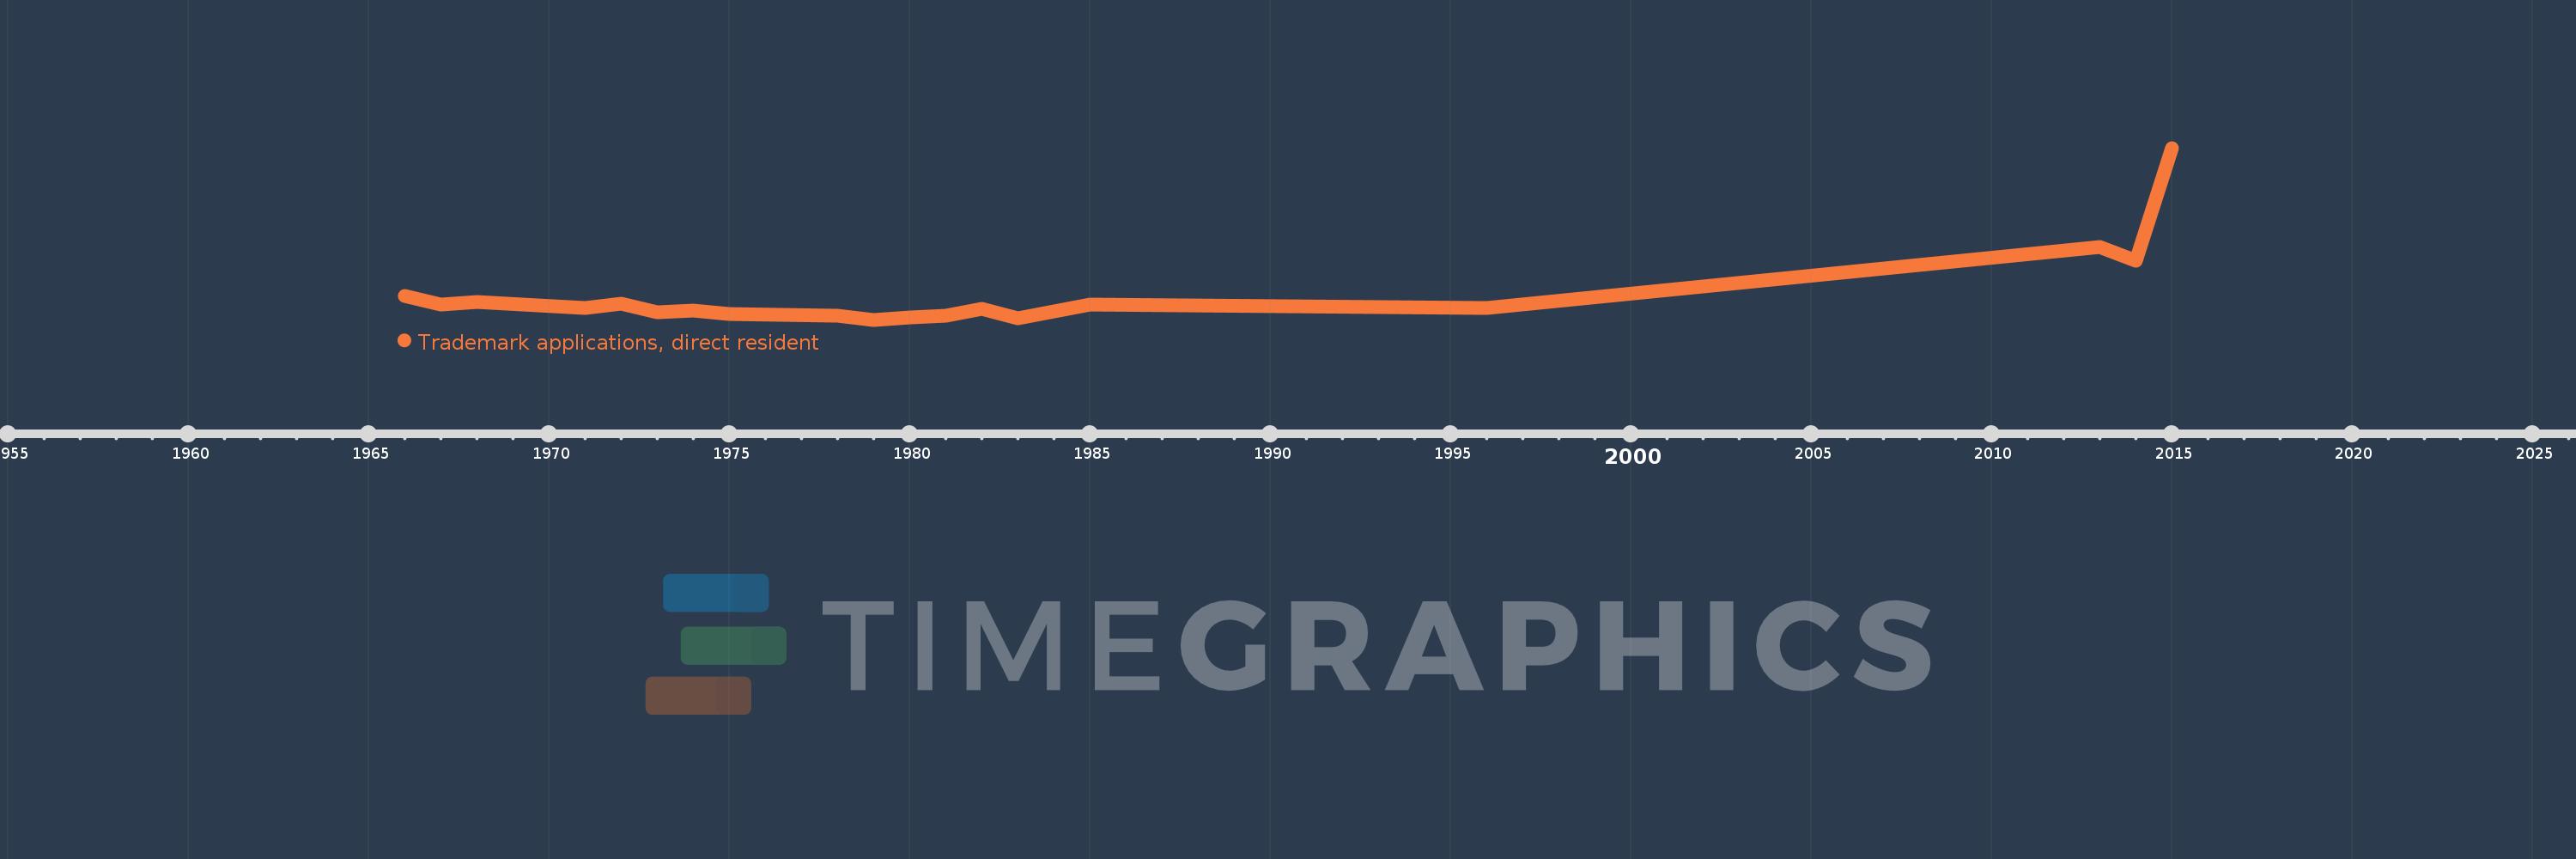
Questa scala temporale mostra un grafico dal 1966 anno al 2015 anno. Sierra Leone. I dati fino ad 1965 anno non disponibili. Il numero di osservazioni attuali secondo i date: 19.
La fonte (nome):
Indicatori dello sviluppo mondiale
La fonte (organizzazione):
World Intellectual Property Organization (WIPO), WIPO Patent Report: Statistics on Worldwide Patent Activity. The International Bureau of WIPO assumes no responsibility with respect to the transformation of these data.
Categorie:
Science & Technology
sono stati aggiornati
23 apr 2017 anni
Indicatori delle variazioni dei valori per anni
In media:
51.0
Minima:
2.0
1 gen 1979 anni
Massimo:
350.0
1 gen 2015 anni
Alla data di osservazione
Valore
Variazione assoluta
La variazione rispetto al valore precedente
1 gen 1966 anni
50.0
+50.0
0.0%
1 gen 1967 anni
32.0
-18.0
-36.0%
1 gen 1968 anni
38.0
+6.0
18.75%
1 gen 1971 anni
26.0
-12.0
-31.58%
1 gen 1972 anni
34.0
+8.0
30.77%
1 gen 1973 anni
18.0
-16.0
-47.06%
1 gen 1974 anni
21.0
+3.0
16.67%
1 gen 1975 anni
14.0
-7.0
-33.33%
1 gen 1978 anni
10.0
-4.0
-28.57%
1 gen 1979 anni
2.0
-8.0
-80.0%
1 gen 1980 anni
6.0
+4.0
200.0%
1 gen 1981 anni
10.0
+4.0
66.67%
1 gen 1982 anni
24.0
+14.0
140.0%
1 gen 1983 anni
5.0
-19.0
-79.17%
1 gen 1985 anni
32.0
+27.0
540.0%
1 gen 1996 anni
25.0
-7.0
-21.88%
1 gen 2013 anni
150.0
+125.0
500.0%
1 gen 2014 anni
122.0
-28.0
-18.67%
1 gen 2015 anni
350.0
+228.0
186.89%
Classificazione dei paesi secondo i statistiche attuali per anni