33
/it/
AIzaSyAYiBZKx7MnpbEhh9jyipgxe19OcubqV5w
August 1, 2025
238375
Seychelles
SYC
true
2
1
Imports of goods and services (annual % growth)
2004,2003,2002,2001,2000,1999,1998,1997,1996,1995,1994,1993,1992,1991,1990,1989,1988,1987
Download
Biblioteca di statistiche globali →Seychelles →

Imports of goods and services (annual % growth)

Queste statistiche in altri paesi:

AlbaniaAlgeriaAngolaAntigua and BarbudaArab WorldArgentinaArmeniaAustraliaAustriaAzerbaijanBahamas, TheBahrainBangladeshBarbadosBelarusBelgiumBelizeBeninBhutanBoliviaBosnia and HerzegovinaBotswanaBrazilBrunei DarussalamBulgariaBurkina FasoBurundiCabo VerdeCambodiaCameroonCanadaCaribbean small statesCentral Europe and the BalticsChadChileColombiaComorosCongo, Dem. Rep.Congo, Rep.Costa RicaCote d'IvoireCroatiaCubaCyprusCzech RepublicDenmarkDjiboutiDominican RepublicEarly-demographic dividendEast Asia & PacificEcuadorEgypt, Arab Rep.El SalvadorEquatorial GuineaEritreaEstoniaEthiopiaEuro areaEurope & Central AsiaEurope & Central Asia (excluding high income)Europe & Central Asia (IDA & IBRD countries)European UnionFijiFinlandFranceGabonGambia, TheGeorgiaGermanyGhanaGreeceGuatemalaGuineaGuinea-BissauHaitiHeavily indebted poor countries (HIPC)High incomeHondurasHong Kong SAR, ChinaHungaryIBRD onlyIcelandIDA & IBRD totalIDA blendIDA onlyIDA totalIndiaIndonesiaIran, Islamic Rep.IrelandIsraelItalyJamaicaJapanJordanKazakhstanKenyaKorea, Rep.KosovoKuwaitKyrgyz RepublicLao PDRLatin America & Caribbean Latin America & Caribbean (excluding high income)Latin America & the Caribbean (IDA & IBRD countries)LatviaLeast developed countries: UN classificationLebanonLiberiaLibyaLithuaniaLow & middle incomeLow incomeLower middle incomeLuxembourgMacao SAR, ChinaMacedonia, FYRMadagascarMalawiMalaysiaMaliMaltaMauritaniaMauritiusMexicoMiddle East & North AfricaMiddle East & North Africa (excluding high income)Middle East & North Africa (IDA & IBRD countries)Middle incomeMoldovaMongoliaMontenegroMoroccoMozambiqueMyanmarNamibiaNepalNetherlandsNew ZealandNicaraguaNigerNigeriaNorth AmericaNorwayOECD membersOmanOther small statesPakistanPanamaPapua New GuineaParaguayPeruPhilippinesPolandPortugalPost-demographic dividendPre-demographic dividendPuerto RicoQatarRomaniaRussian FederationRwandaSamoaSaudi ArabiaSenegalSerbiaSeychellesSierra LeoneSingaporeSlovak RepublicSloveniaSmall statesSomaliaSouth AfricaSouth AsiaSouth Asia (IDA & IBRD)South SudanSpainSri LankaSub-Saharan Africa Sub-Saharan Africa (excluding high income)Sub-Saharan Africa (IDA & IBRD countries)SudanSurinameSwazilandSwedenSwitzerlandSyrian Arab RepublicTajikistanTanzaniaThailandTimor-LesteTogoTrinidad and TobagoTunisiaTurkeyTurkmenistanUgandaUkraineUnited Arab EmiratesUnited KingdomUnited StatesUruguayUzbekistanVanuatuVenezuela, RBVietnamWest Bank and GazaWorldZambiaZimbabwe

Linea del tempo:

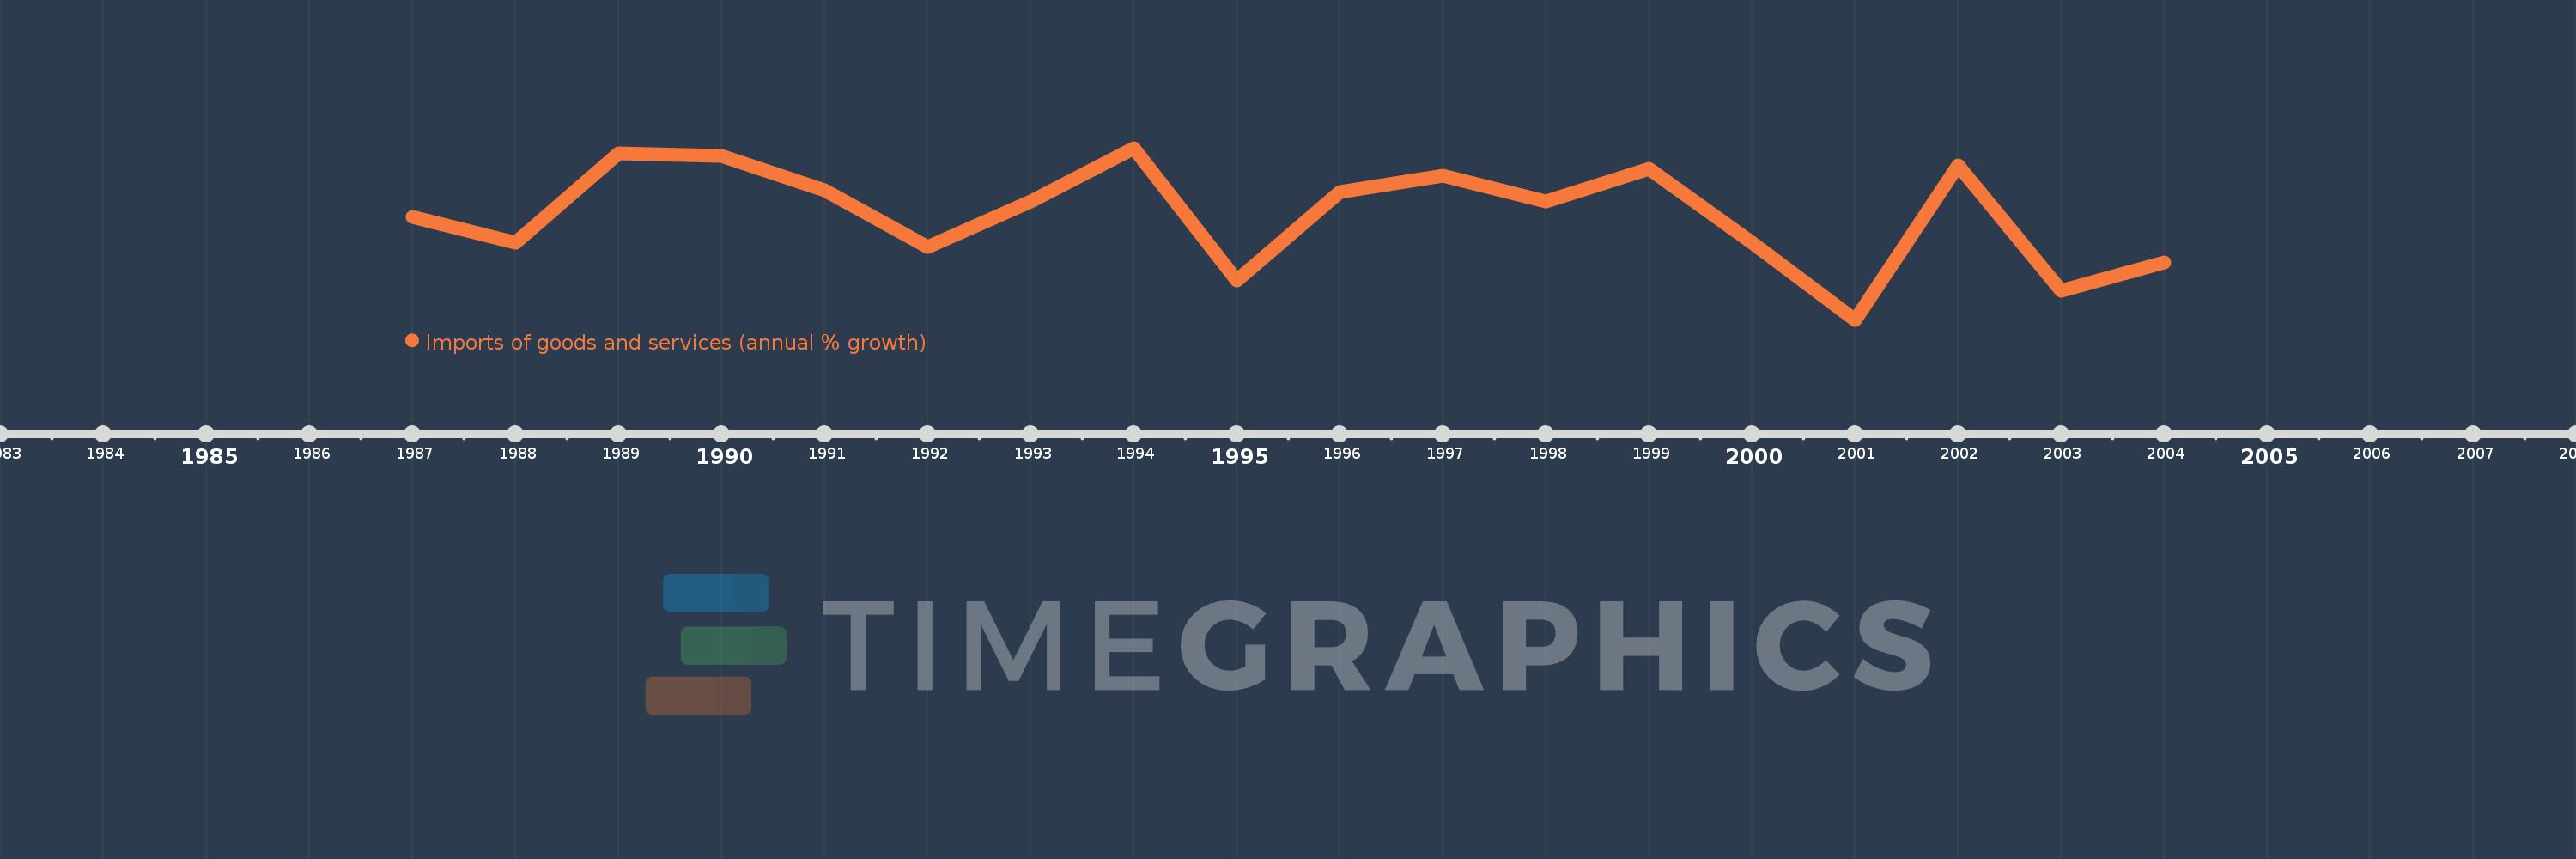
Questa scala temporale mostra un grafico dal 1987 anno al 2004 anno. Seychelles. I dati fino ad 1986 anno non disponibili. Il numero di osservazioni attuali secondo i date: 18.

La fonte (nome):

Indicatori dello sviluppo mondiale

La fonte (organizzazione):

World Bank national accounts data, and OECD National Accounts data files.

Categorie:

Economy & Growth, Trade

sono stati aggiornati

23 apr 2017 anni

Indicatori delle variazioni dei valori per anni

In media:
8.096
Minima:
-27.53
1 gen 2001 anni
Massimo:
30.423
1 gen 1994 anni
Alla data di osservazione
Valore
Variazione assoluta
La variazione rispetto al valore precedente
1 gen 1987 anni
7.024
+7.024
0.0%
1 gen 1988 anni
-1.547
-8.57
-122.02%
1 gen 1989 anni
28.46
+30.007
-1.94 Mille.%
1 gen 1990 anni
27.785
-0.676
-2.37%
1 gen 1991 anni
16.212
-11.572
-41.65%
1 gen 1992 anni
-2.997
-19.209
-118.48%
1 gen 1993 anni
12.401
+15.397
-513.82%
1 gen 1994 anni
30.423
+18.022
145.33%
1 gen 1995 anni
-14.228
-44.651
-146.77%
1 gen 1996 anni
15.626
+29.854
-209.82%
1 gen 1997 anni
21.057
+5.432
34.76%
1 gen 1998 anni
12.515
-8.543
-40.57%
1 gen 1999 anni
23.504
+10.99
87.82%
1 gen 2000 anni
-1.429
-24.933
-106.08%
1 gen 2001 anni
-27.53
-26.101
1.83 Mille.%
1 gen 2002 anni
24.639
+52.169
-189.5%
1 gen 2003 anni
-17.857
-42.496
-172.47%
1 gen 2004 anni
-8.333
+9.524
-53.33%

Classificazione dei paesi secondo i statistiche attuali per anni