33
/it/
AIzaSyB4mHJ5NPEv-XzF7P6NDYXjlkCWaeKw5bc
November 30, 2025
238168
Seychelles
SYC
true
2
1
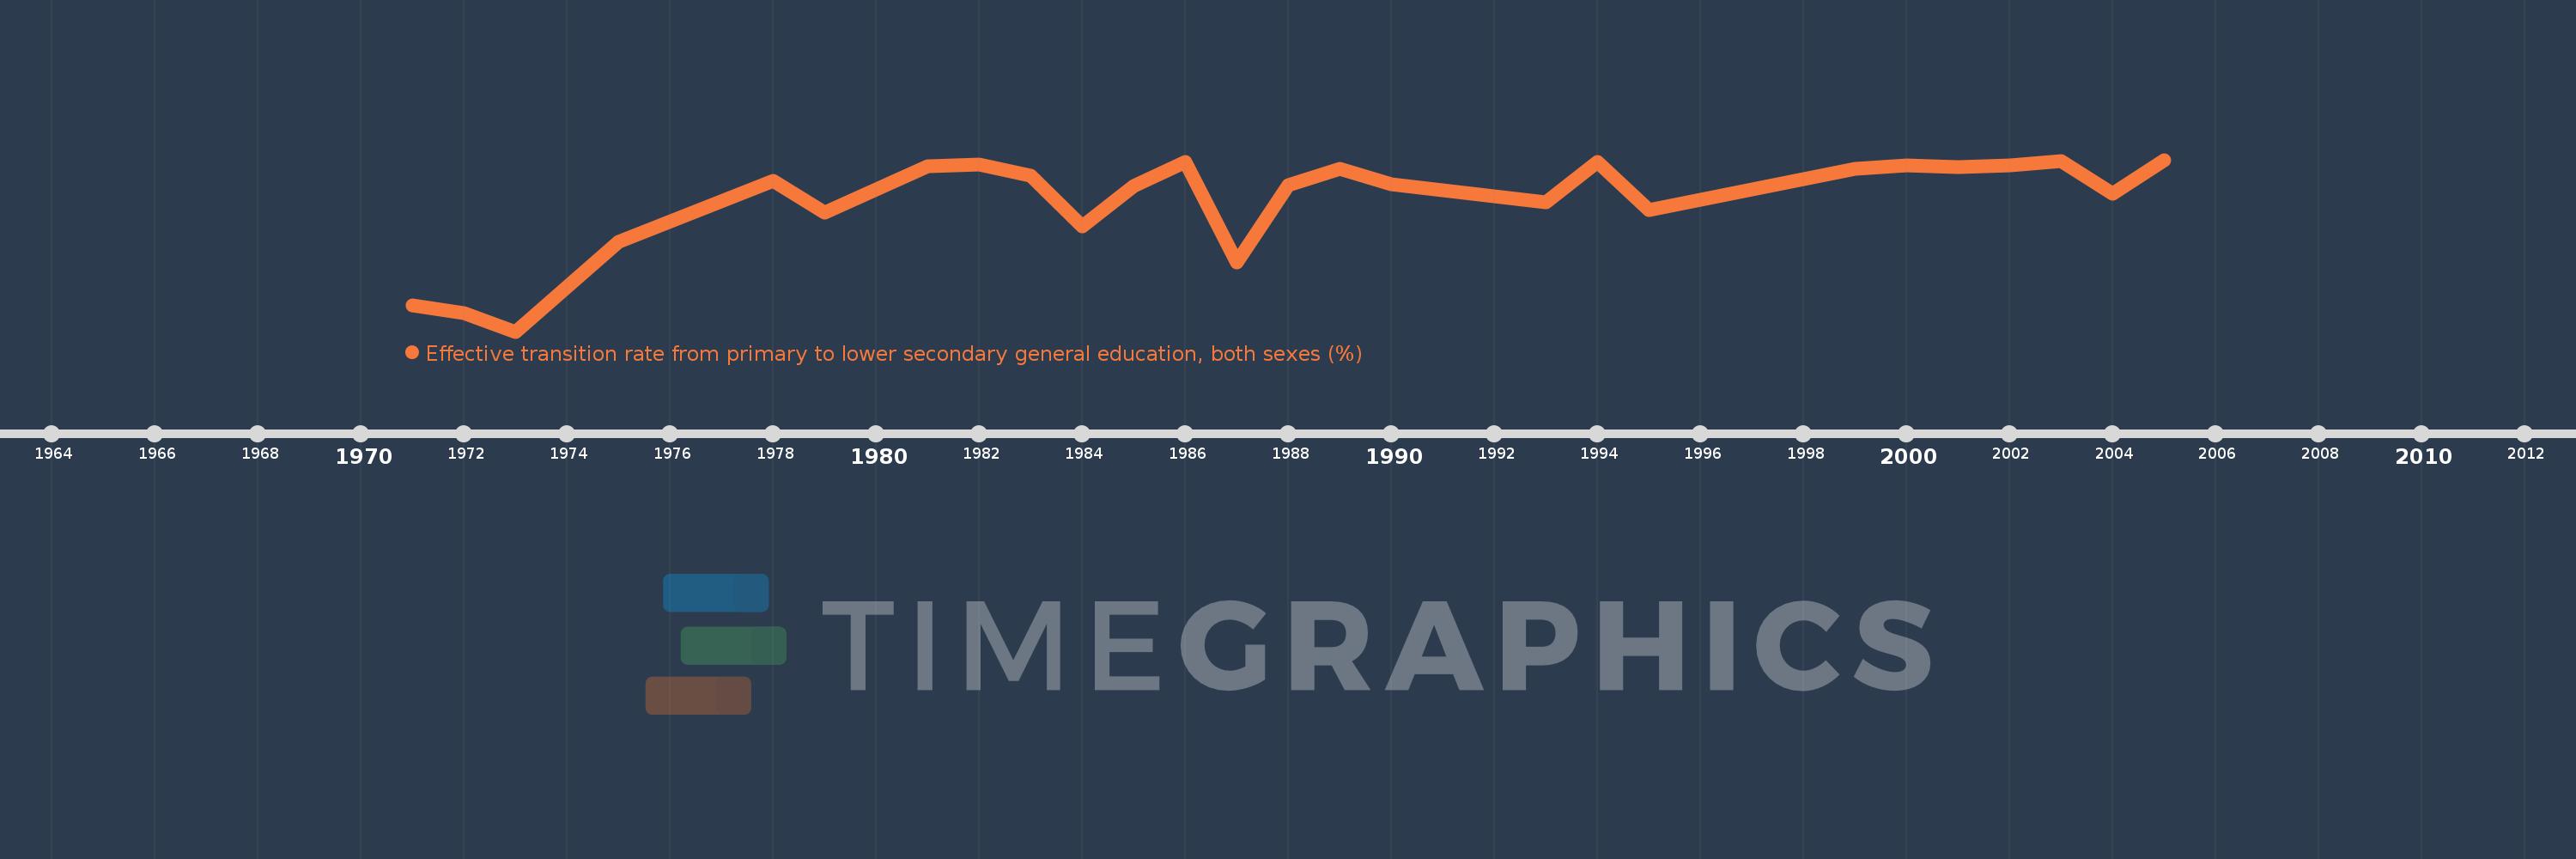
Effective transition rate from primary to lower secondary general education, both sexes (%)
2005,2004,2003,2002,2001,2000,1999,1995,1994,1993,1990,1989,1988,1987,1986,1985,1984,1983,1982,1981,1979,1978,1975,1973,1972,1971