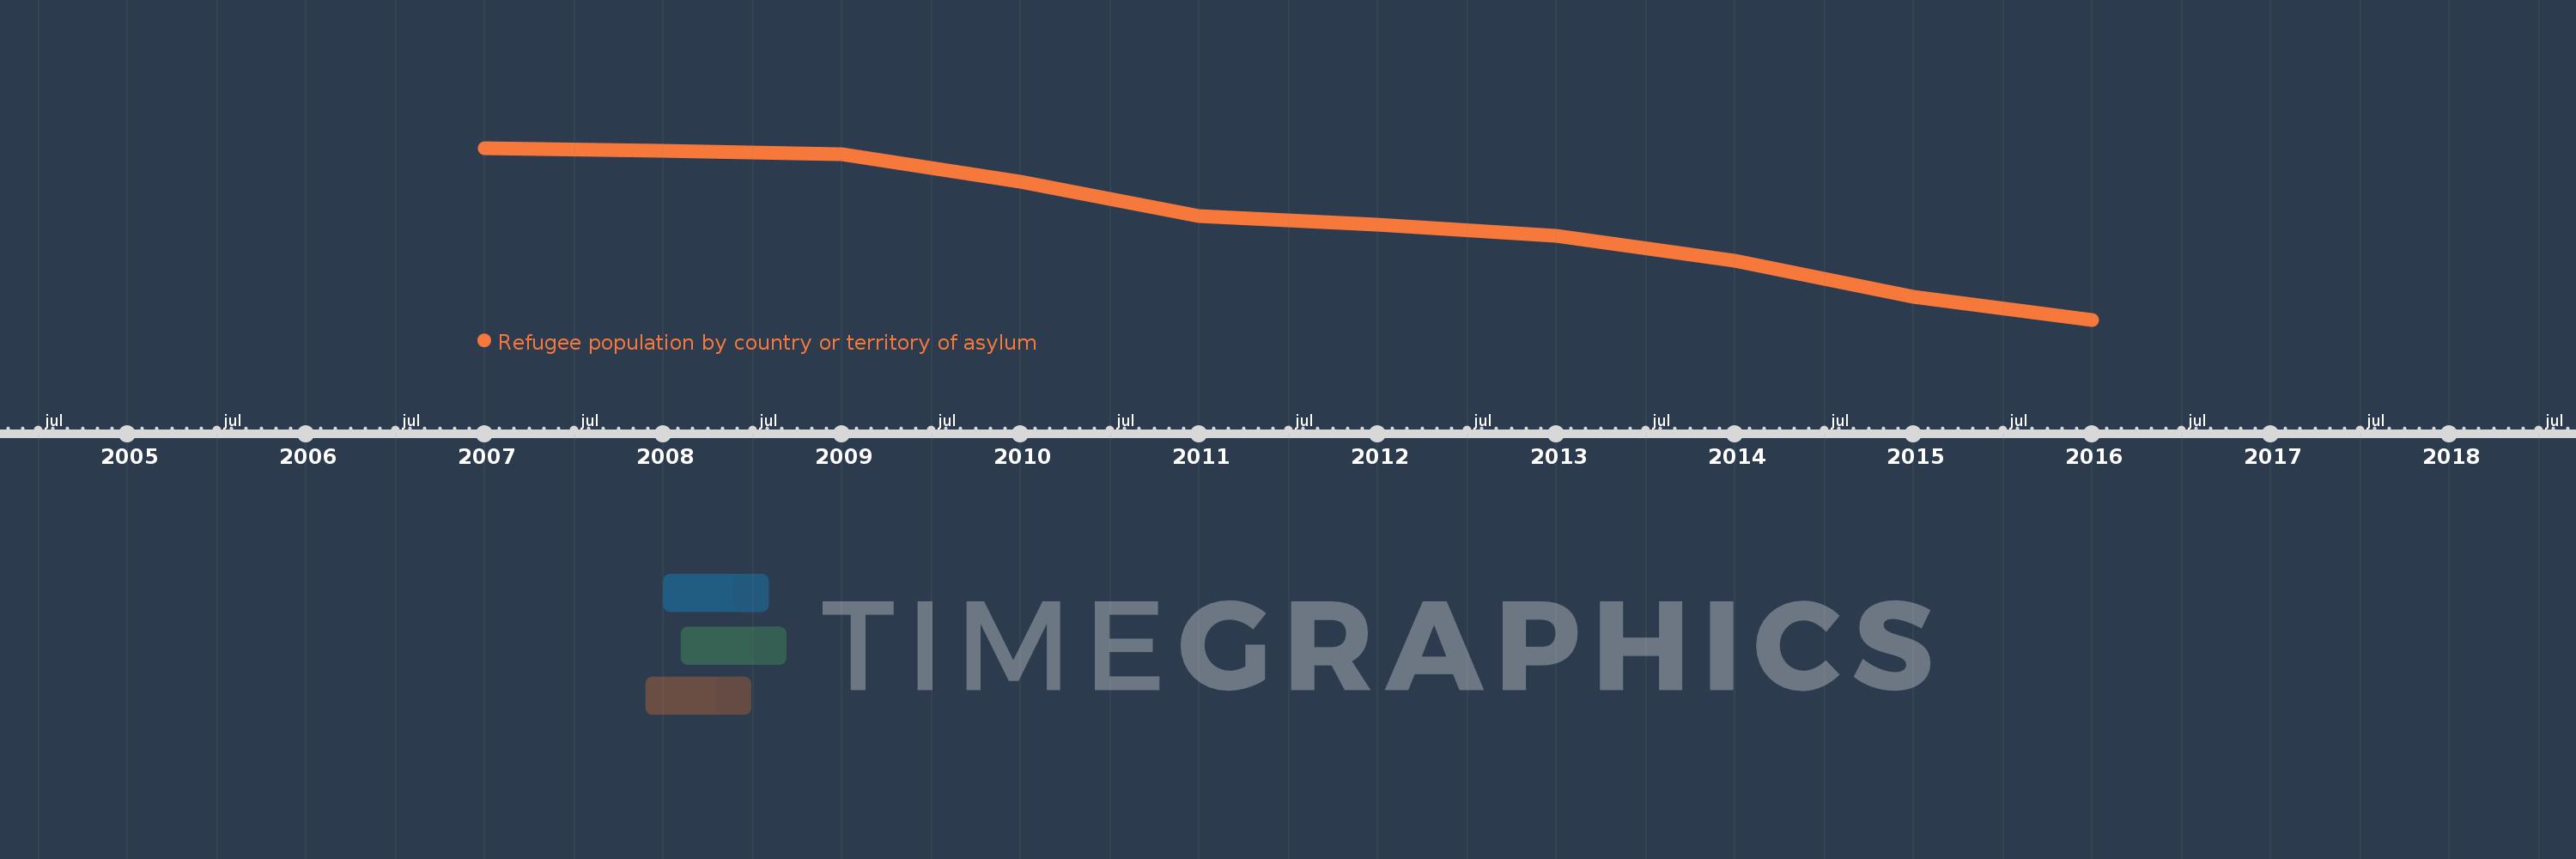
Questa scala temporale mostra un grafico dal 2007 anno al 2016 anno. Serbia. I dati fino ad 2006 anno non disponibili. Il numero di osservazioni attuali secondo i date: 10.
La fonte (nome):
Indicatori dello sviluppo mondiale
La fonte (organizzazione):
United Nations High Commissioner for Refugees (UNHCR), Statistical Yearbook and data files, complemented by statistics on Palestinian refugees under the mandate of the UNRWA as published on its website. Data from UNHCR are available online at: www.unhcr.org/statistics/populationdatabase.
Categorie:
Health, Social Development
sono stati aggiornati
23 apr 2017 anni
Indicatori delle variazioni dei valori per anni
In media:
72.693 Mille.
Minima:
35.332 Mille.
1 gen 2016 anni
Massimo:
98.997 Mille.
1 gen 2007 anni
Alla data di osservazione
Valore
Variazione assoluta
La variazione rispetto al valore precedente
1 gen 2007 anni
98.997 Mille.
+98.997 Mille.
0.0%
1 gen 2008 anni
97.995 Mille.
-1.002 Mille.
-1.01%
1 gen 2009 anni
96.739 Mille.
-1.256 Mille.
-1.28%
1 gen 2010 anni
86.351 Mille.
-10.388 Mille.
-10.74%
1 gen 2011 anni
73.608 Mille.
-12.743 Mille.
-14.76%
1 gen 2012 anni
70.707 Mille.
-2.901 Mille.
-3.94%
1 gen 2013 anni
66.37 Mille.
-4.337 Mille.
-6.13%
1 gen 2014 anni
57.083 Mille.
-9.287 Mille.
-13.99%
1 gen 2015 anni
43.751 Mille.
-13.332 Mille.
-23.36%
1 gen 2016 anni
35.332 Mille.
-8.419 Mille.
-19.24%
Classificazione dei paesi secondo i statistiche attuali per anni