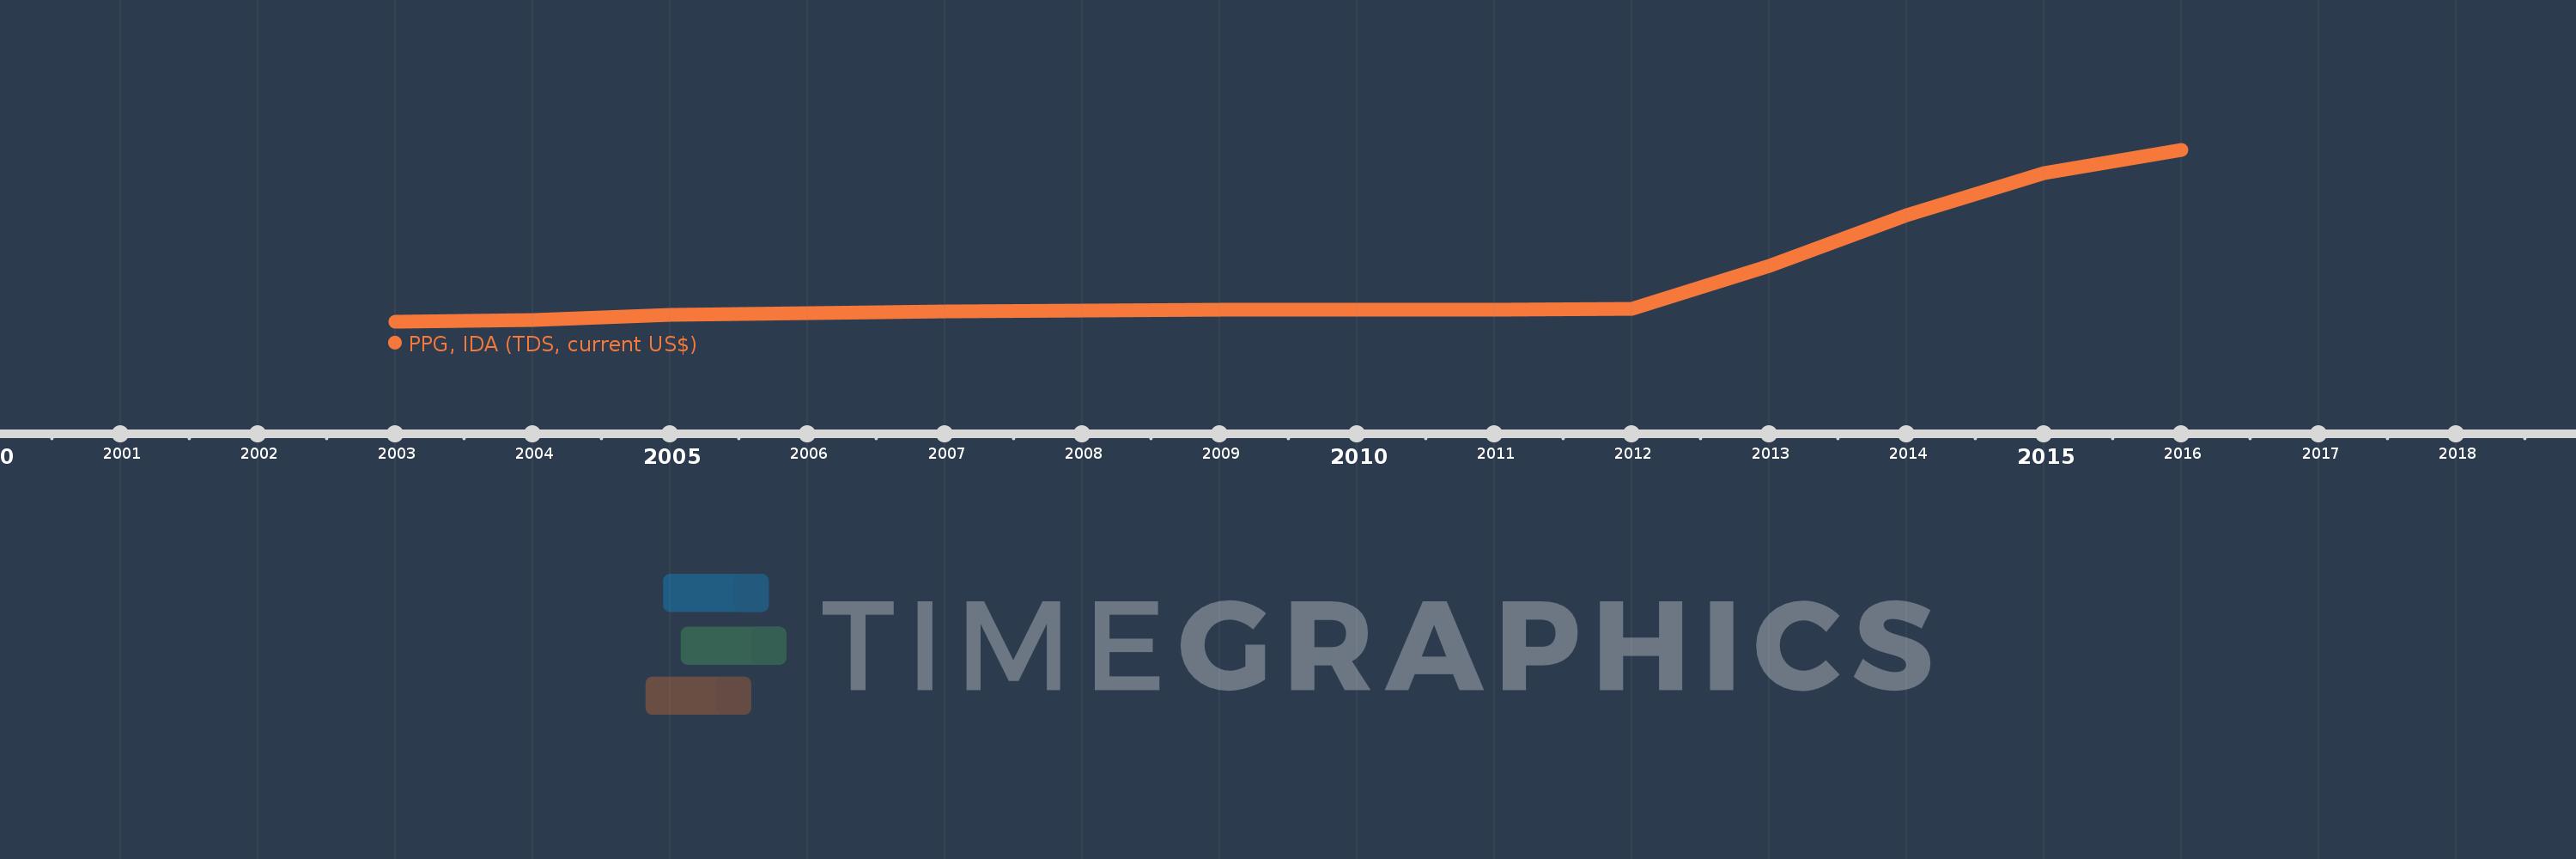
Questa scala temporale mostra un grafico dal 2003 anno al 2016 anno. Serbia. I dati fino ad 2002 anno non disponibili. Il numero di osservazioni attuali secondo i date: 14.
La fonte (nome):
Indicatori dello sviluppo mondiale
La fonte (organizzazione):
World Bank, International Debt Statistics.
Categorie:
External Debt
sono stati aggiornati
23 apr 2017 anni
Indicatori delle variazioni dei valori per anni
In media:
15.122 Mln
Minima:
481.0 Mille.
1 gen 2003 anni
Massimo:
61.952 Mln
1 gen 2016 anni
Alla data di osservazione
Valore
Variazione assoluta
La variazione rispetto al valore precedente
1 gen 2003 anni
481.0 Mille.
+481.0 Mille.
0.0%
1 gen 2004 anni
1.311 Mln
+830.0 Mille.
172.56%
1 gen 2005 anni
2.954 Mln
+1.643 Mln
125.32%
1 gen 2006 anni
3.575 Mln
+621.0 Mille.
21.02%
1 gen 2007 anni
4.194 Mln
+619.0 Mille.
17.31%
1 gen 2008 anni
4.565 Mln
+371.0 Mille.
8.85%
1 gen 2009 anni
4.768 Mln
+203.0 Mille.
4.45%
1 gen 2010 anni
4.951 Mln
+183.0 Mille.
3.84%
1 gen 2011 anni
4.965 Mln
+14.0 Mille.
0.28%
1 gen 2012 anni
5.248 Mln
+283.0 Mille.
5.7%
1 gen 2013 anni
20.445 Mln
+15.197 Mln
289.58%
1 gen 2014 anni
38.548 Mln
+18.103 Mln
88.54%
1 gen 2015 anni
53.756 Mln
+15.208 Mln
39.45%
1 gen 2016 anni
61.952 Mln
+8.196 Mln
15.25%
Classificazione dei paesi secondo i statistiche attuali per anni