29
/it/
it
AIzaSyAYiBZKx7MnpbEhh9jyipgxe19OcubqV5w
April 1, 2024
237442
Serbia
SRB
true
2
1
Net bilateral aid flows from DAC donors, Germany (current US$)
2015,2014,2013,2012,2011,2010,2009,2008,2007,2006,2005,2004,2003,2002,2001,2000,1999,1998,1997,1996
Download
Biblioteca di statistiche globali →Serbia →

Net bilateral aid flows from DAC donors, Germany (current US$)

Queste statistiche in altri paesi:
AfghanistanAlbaniaAlgeriaAngolaAntigua and BarbudaArab WorldArgentinaArmeniaAzerbaijanBahamas, TheBahrainBangladeshBarbadosBelarusBelizeBeninBermudaBhutanBoliviaBosnia and HerzegovinaBotswanaBrazilBritish Virgin IslandsBrunei DarussalamBulgariaBurkina FasoBurundiCabo VerdeCambodiaCameroonCaribbean small statesCayman IslandsCentral African RepublicCentral Europe and the BalticsChadChileChinaColombiaComorosCongo, Dem. Rep.Congo, Rep.Costa RicaCote d'IvoireCroatiaCubaCyprusCzech RepublicDjiboutiDominicaDominican RepublicEast Asia & PacificEast Asia & Pacific (excluding high income)East Asia & Pacific (IDA & IBRD countries)EcuadorEgypt, Arab Rep.El SalvadorEquatorial GuineaEritreaEstoniaEthiopiaEuro areaEurope & Central AsiaEurope & Central Asia (excluding high income)Europe & Central Asia (IDA & IBRD countries)European UnionFijiFragile and conflict affected situationsFrench PolynesiaGabonGambia, TheGeorgiaGhanaGibraltarGrenadaGuatemalaGuineaGuinea-BissauGuyanaHaitiHeavily indebted poor countries (HIPC)High incomeHondurasHong Kong SAR, ChinaHungaryIBRD onlyIDA & IBRD totalIDA blendIDA onlyIDA totalIndiaIndonesiaIran, Islamic Rep.IraqIsraelJamaicaJordanKazakhstanKenyaKiribatiKorea, Dem. People’s Rep.Korea, Rep.KosovoKuwaitKyrgyz RepublicLao PDRLatin America & Caribbean Latin America & Caribbean (excluding high income)Latin America & the Caribbean (IDA & IBRD countries)LatviaLeast developed countries: UN classificationLebanonLesothoLiberiaLibyaLithuaniaLow & middle incomeLow incomeLower middle incomeMacao SAR, ChinaMacedonia, FYRMadagascarMalawiMalaysiaMaldivesMaliMaltaMarshall IslandsMauritaniaMauritiusMexicoMicronesia, Fed. Sts.Middle East & North AfricaMiddle East & North Africa (excluding high income)Middle East & North Africa (IDA & IBRD countries)Middle incomeMoldovaMongoliaMontenegroMoroccoMozambiqueMyanmarNamibiaNauruNepalNicaraguaNigerNigeriaNorth AmericaNorthern Mariana IslandsOECD membersOmanOther small statesPacific island small statesPakistanPalauPanamaPapua New GuineaParaguayPeruPhilippinesPolandQatarRomaniaRussian FederationRwandaSamoaSao Tome and PrincipeSaudi ArabiaSenegalSerbiaSeychellesSierra LeoneSingaporeSlovak RepublicSloveniaSmall statesSolomon IslandsSomaliaSouth AfricaSouth AsiaSouth Asia (IDA & IBRD)South SudanSri LankaSt. Kitts and NevisSt. LuciaSt. Vincent and the GrenadinesSub-Saharan Africa Sub-Saharan Africa (excluding high income)Sub-Saharan Africa (IDA & IBRD countries)SudanSurinameSwazilandSyrian Arab RepublicTajikistanTanzaniaThailandTimor-LesteTogoTongaTrinidad and TobagoTunisiaTurkeyTurkmenistanTuvaluUgandaUkraineUnited Arab EmiratesUpper middle incomeUruguayUzbekistanVanuatuVenezuela, RBVietnamWest Bank and GazaWorldYemen, Rep.ZambiaZimbabwe
Linea del tempo:
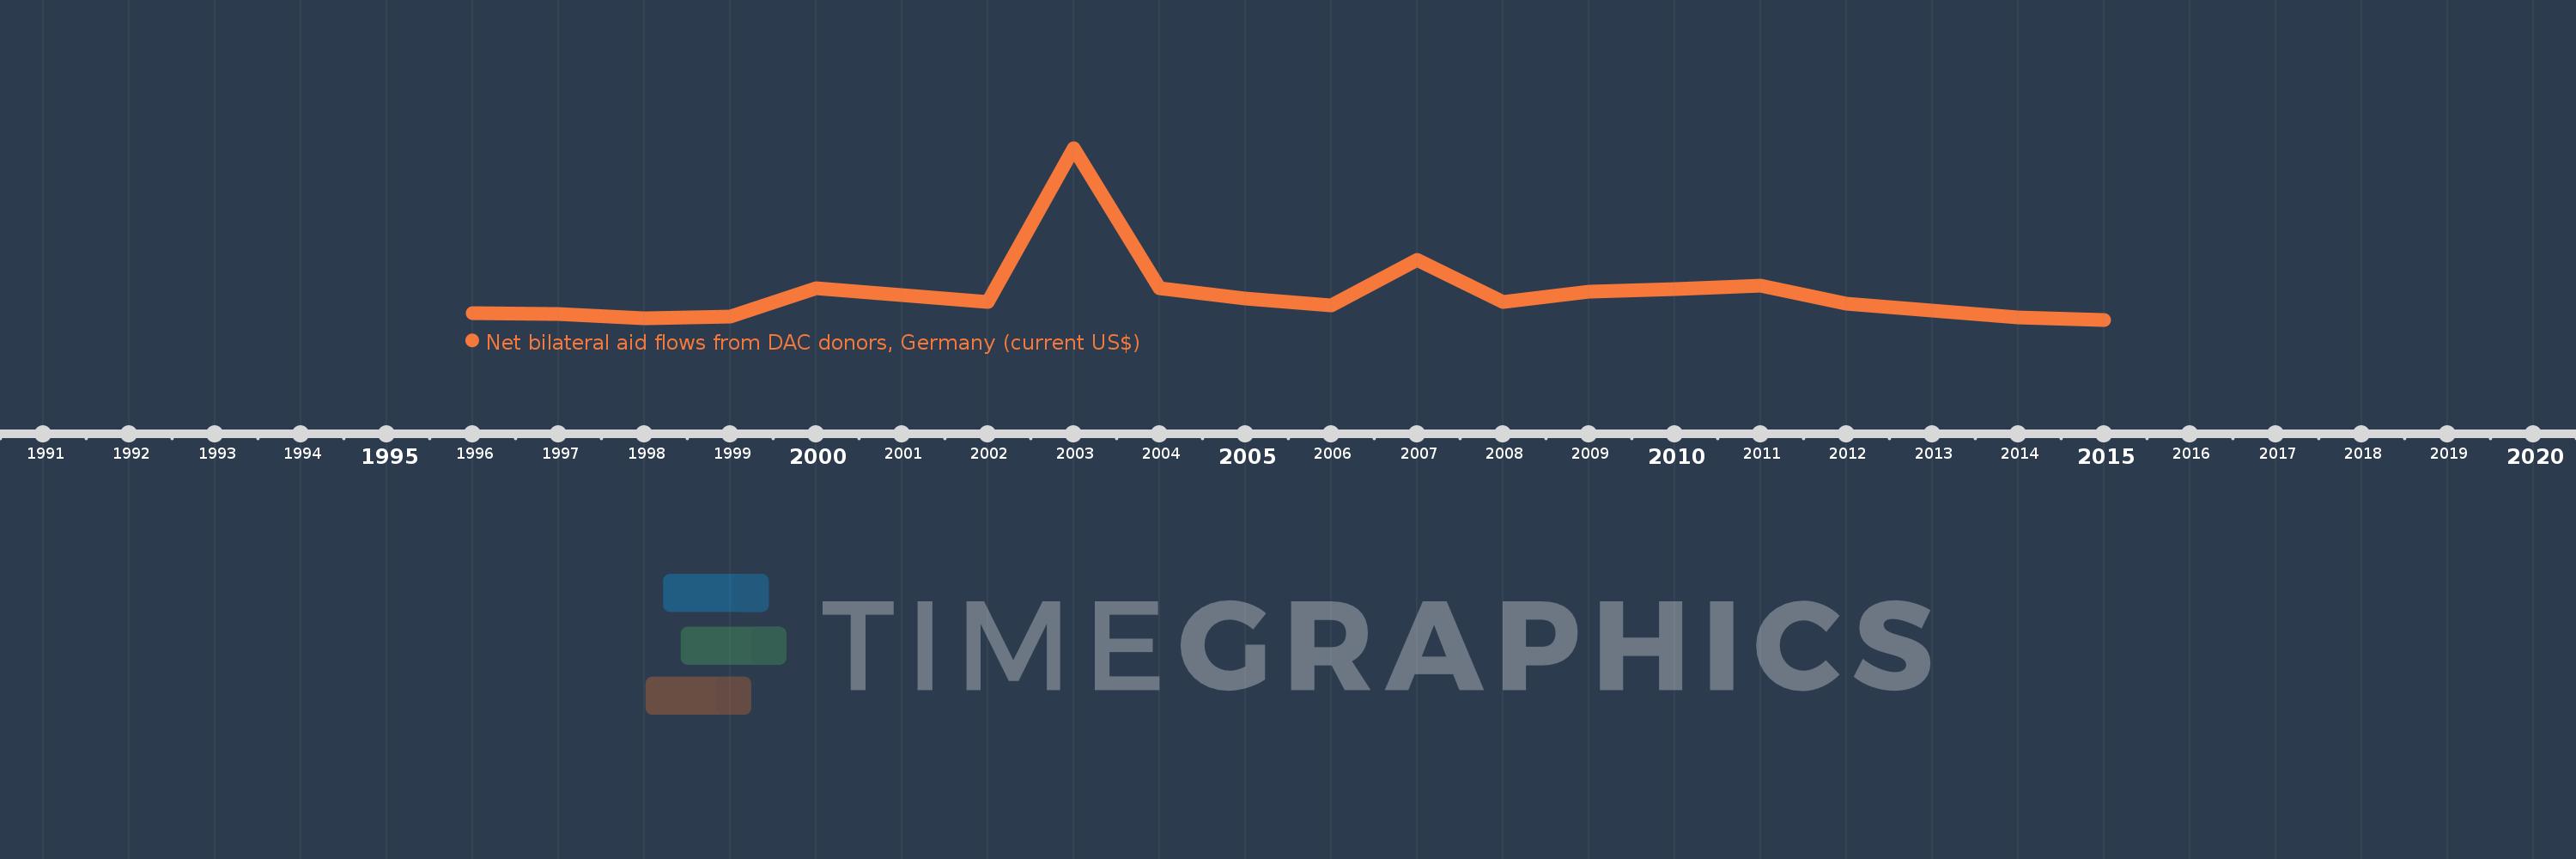
Questa scala temporale mostra un grafico dal 1996 anno al 2015 anno. Serbia. I dati fino ad 1995 anno non disponibili. Il numero di osservazioni attuali secondo i date: 20.
La fonte (nome):
Indicatori dello sviluppo mondiale
La fonte (organizzazione):
Development Assistance Committee of the Organisation for Economic Co-operation and Development, Geographical Distribution of Financial Flows to Developing Countries, Development Co-operation Report, and International Development Statistics database. Data are available online at: www.oecd.org/dac/stats/idsonline.
Categorie:
Aid Effectiveness
sono stati aggiornati
23 apr 2017 anni
Indicatori delle variazioni dei valori per anni
In media:
102.818 Mln
Minima:
24.85 Mln
1 gen 2015 anni
Massimo:
531.41 Mln
1 gen 2003 anni
Alla data di osservazione
Valore
Variazione assoluta
La variazione rispetto al valore precedente
1 gen 1996 anni
43.79 Mln
+43.79 Mln
0.0%
1 gen 1997 anni
41.61 Mln
-2.18 Mln
-4.98%
1 gen 1998 anni
28.39 Mln
-13.22 Mln
-31.77%
1 gen 1999 anni
34.2 Mln
+5.81 Mln
20.46%
1 gen 2000 anni
119.05 Mln
+84.85 Mln
248.1%
1 gen 2001 anni
98.65 Mln
-20.4 Mln
-17.14%
1 gen 2002 anni
78.28 Mln
-20.37 Mln
-20.65%
1 gen 2003 anni
531.41 Mln
+453.13 Mln
578.86%
1 gen 2004 anni
116.75 Mln
-414.66 Mln
-78.03%
1 gen 2005 anni
87.36 Mln
-29.39 Mln
-25.17%
1 gen 2006 anni
67.81 Mln
-19.55 Mln
-22.38%
1 gen 2007 anni
202.49 Mln
+134.68 Mln
198.61%
1 gen 2008 anni
78.39 Mln
-124.1 Mln
-61.29%
1 gen 2009 anni
107.81 Mln
+29.42 Mln
37.53%
1 gen 2010 anni
114.53 Mln
+6.72 Mln
6.23%
1 gen 2011 anni
126.26 Mln
+11.73 Mln
10.24%
1 gen 2012 anni
71.46 Mln
-54.8 Mln
-43.4%
1 gen 2013 anni
52.61 Mln
-18.85 Mln
-26.38%
1 gen 2014 anni
30.66 Mln
-21.95 Mln
-41.72%
1 gen 2015 anni
24.85 Mln
-5.81 Mln
-18.95%
Classificazione dei paesi secondo i statistiche attuali per anni

Commenti:

Inviare
PremiumAbout & FeedbackAccordoPrivatezza
logo
© 2022 Selected Technologies LLC – Morgan Hill, California