33
/it/
AIzaSyAYiBZKx7MnpbEhh9jyipgxe19OcubqV5w
August 1, 2025
234258
Sao Tome and Principe
STP
true
2
1
Total reserves (% of total external debt)
2016,2015,2014,2013,2012,2011,2010,2009,2008,2007,2006,2005,2004,2003,2002,2001,2000,1999,1998,1997,1996
Download
Biblioteca di statistiche globali →Sao Tome and Principe →

Total reserves (% of total external debt)

Queste statistiche in altri paesi:

AfghanistanAlbaniaAlgeriaAngolaArab WorldArgentinaArmeniaAzerbaijanBangladeshBelarusBelizeBeninBhutanBoliviaBosnia and HerzegovinaBotswanaBrazilBulgariaBurkina FasoBurundiCabo VerdeCambodiaCameroonCaribbean small statesCentral African RepublicCentral Europe and the BalticsChadChinaColombiaComorosCongo, Dem. Rep.Congo, Rep.Costa RicaCote d'IvoireDjiboutiDominicaDominican RepublicEarly-demographic dividendEast Asia & PacificEast Asia & Pacific (excluding high income)East Asia & Pacific (IDA & IBRD countries)EcuadorEgypt, Arab Rep.El SalvadorEritreaEthiopiaEurope & Central AsiaEurope & Central Asia (excluding high income)Europe & Central Asia (IDA & IBRD countries)FijiFragile and conflict affected situationsGabonGambia, TheGeorgiaGhanaGrenadaGuatemalaGuineaGuinea-BissauGuyanaHaitiHeavily indebted poor countries (HIPC)HondurasIBRD onlyIDA & IBRD totalIDA blendIDA onlyIDA totalIndiaIndonesiaIran, Islamic Rep.JamaicaJordanKazakhstanKenyaKosovoKyrgyz RepublicLao PDRLate-demographic dividendLatin America & Caribbean Latin America & Caribbean (excluding high income)Latin America & the Caribbean (IDA & IBRD countries)Least developed countries: UN classificationLebanonLesothoLiberiaLow & middle incomeLow incomeLower middle incomeMacedonia, FYRMadagascarMalawiMalaysiaMaldivesMaliMauritaniaMauritiusMexicoMiddle East & North AfricaMiddle East & North Africa (excluding high income)Middle East & North Africa (IDA & IBRD countries)Middle incomeMoldovaMongoliaMontenegroMoroccoMozambiqueMyanmarNepalNicaraguaNigerNigeriaOther small statesPacific island small statesPakistanPanamaPapua New GuineaParaguayPeruPhilippinesPre-demographic dividendRomaniaRussian FederationRwandaSamoaSao Tome and PrincipeSenegalSerbiaSierra LeoneSmall statesSolomon IslandsSouth AfricaSouth AsiaSouth Asia (IDA & IBRD)Sri LankaSt. LuciaSt. Vincent and the GrenadinesSub-Saharan Africa Sub-Saharan Africa (excluding high income)Sub-Saharan Africa (IDA & IBRD countries)SudanSwazilandSyrian Arab RepublicTajikistanTanzaniaThailandTogoTongaTunisiaTurkeyUgandaUkraineUpper middle incomeVanuatuVenezuela, RBVietnamYemen, Rep.ZambiaZimbabwe

Linea del tempo:

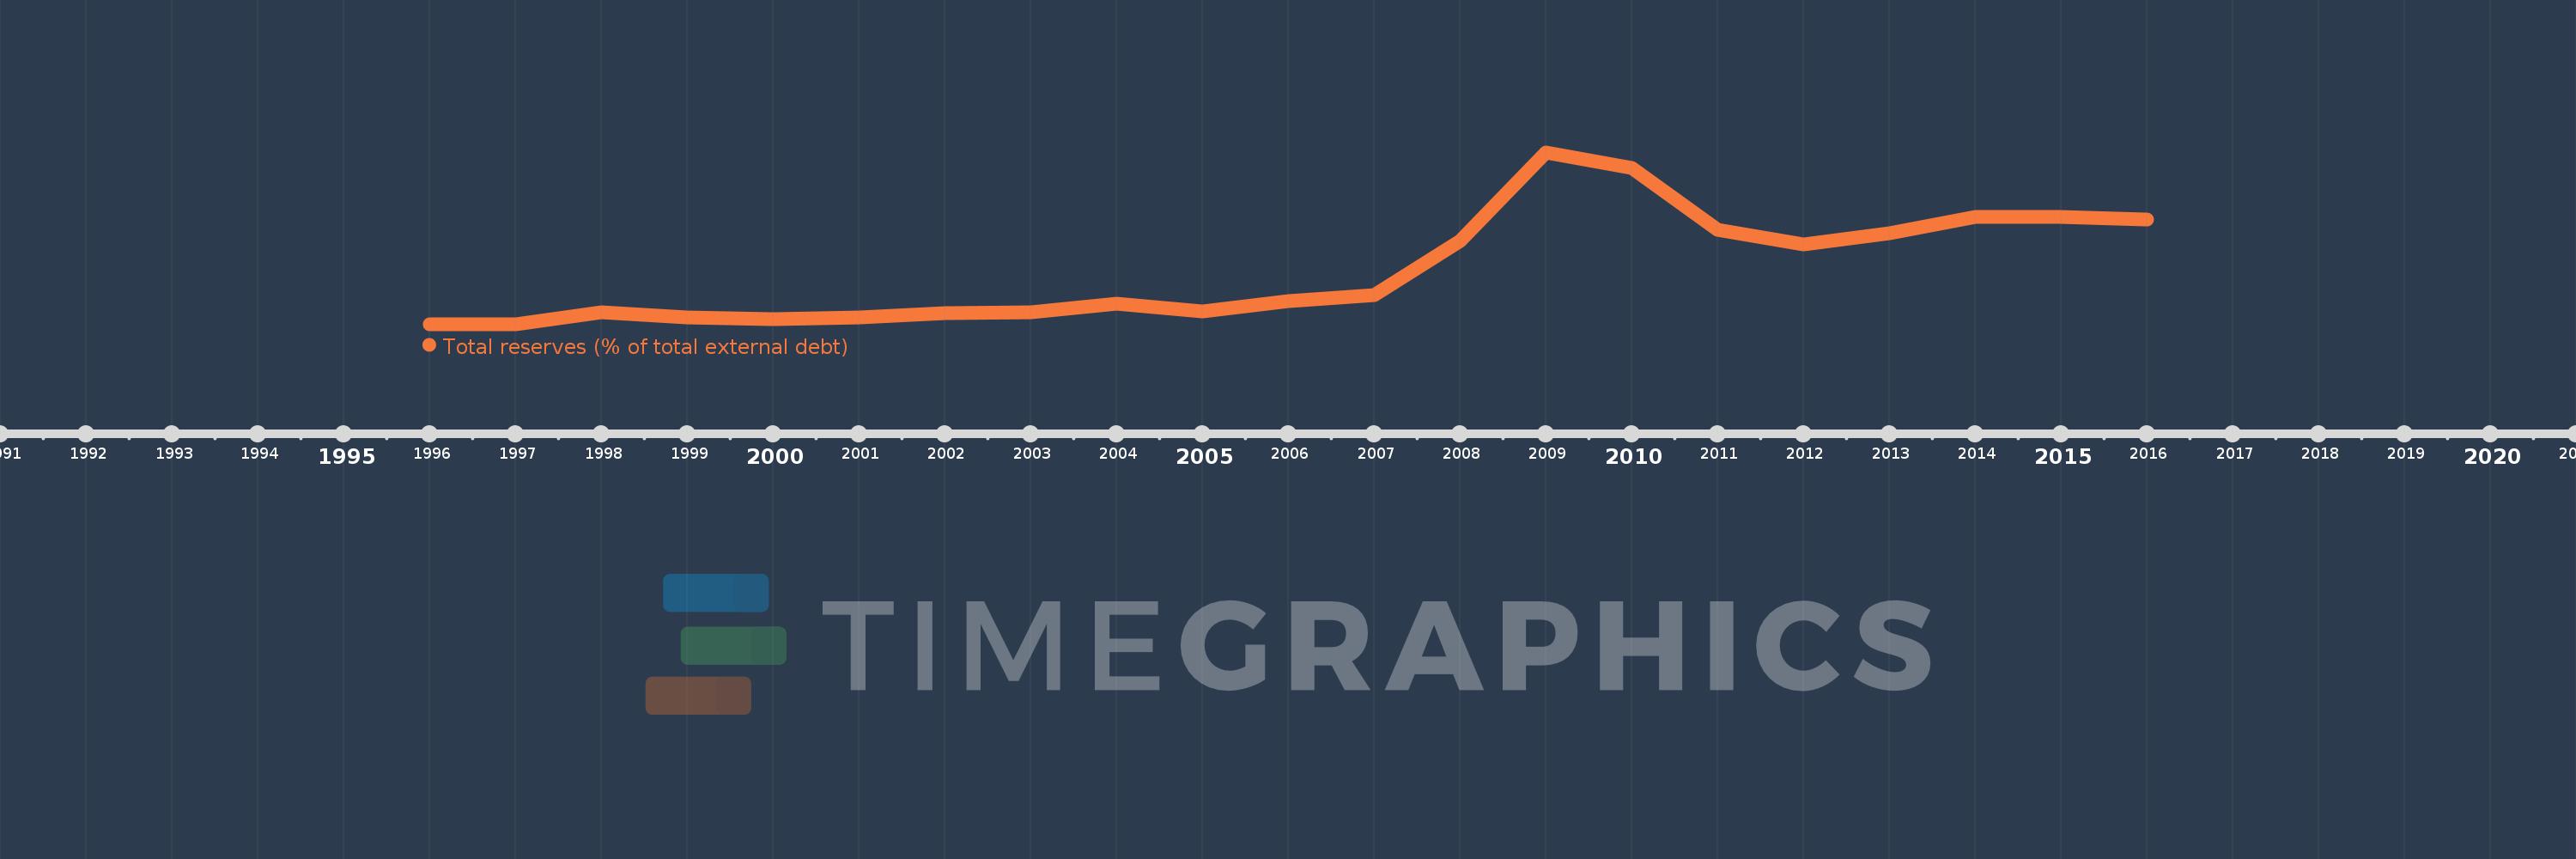
Questa scala temporale mostra un grafico dal 1996 anno al 2016 anno. Sao Tome and Principe. I dati fino ad 1995 anno non disponibili. Il numero di osservazioni attuali secondo i date: 21.

La fonte (nome):

Indicatori dello sviluppo mondiale

La fonte (organizzazione):

World Bank, International Debt Statistics.

Categorie:

Financial Sector, External Debt

sono stati aggiornati

23 apr 2017 anni

Indicatori delle variazioni dei valori per anni

In media:
16.065
Minima:
2.091
1 gen 1996 anni
Massimo:
46.53
1 gen 2009 anni
Alla data di osservazione
Valore
Variazione assoluta
La variazione rispetto al valore precedente
1 gen 1996 anni
2.091
+2.091
0.0%
1 gen 1997 anni
2.137
+0.046
2.19%
1 gen 1998 anni
5.217
+3.08
144.1%
1 gen 1999 anni
3.749
-1.468
-28.14%
1 gen 2000 anni
3.38
-0.369
-9.83%
1 gen 2001 anni
3.818
+0.438
12.96%
1 gen 2002 anni
5.021
+1.202
31.49%
1 gen 2003 anni
5.204
+0.183
3.65%
1 gen 2004 anni
7.492
+2.288
43.97%
1 gen 2005 anni
5.402
-2.09
-27.9%
1 gen 2006 anni
7.957
+2.555
47.3%
1 gen 2007 anni
9.723
+1.766
22.2%
1 gen 2008 anni
23.667
+13.944
143.42%
1 gen 2009 anni
46.53
+22.863
96.6%
1 gen 2010 anni
42.457
-4.073
-8.75%
1 gen 2011 anni
26.6
-15.857
-37.35%
1 gen 2012 anni
22.646
-3.954
-14.87%
1 gen 2013 anni
25.607
+2.961
13.08%
1 gen 2014 anni
29.772
+4.165
16.26%
1 gen 2015 anni
29.785
+0.013
0.04%
1 gen 2016 anni
29.117
-0.668
-2.24%

Classificazione dei paesi secondo i statistiche attuali per anni