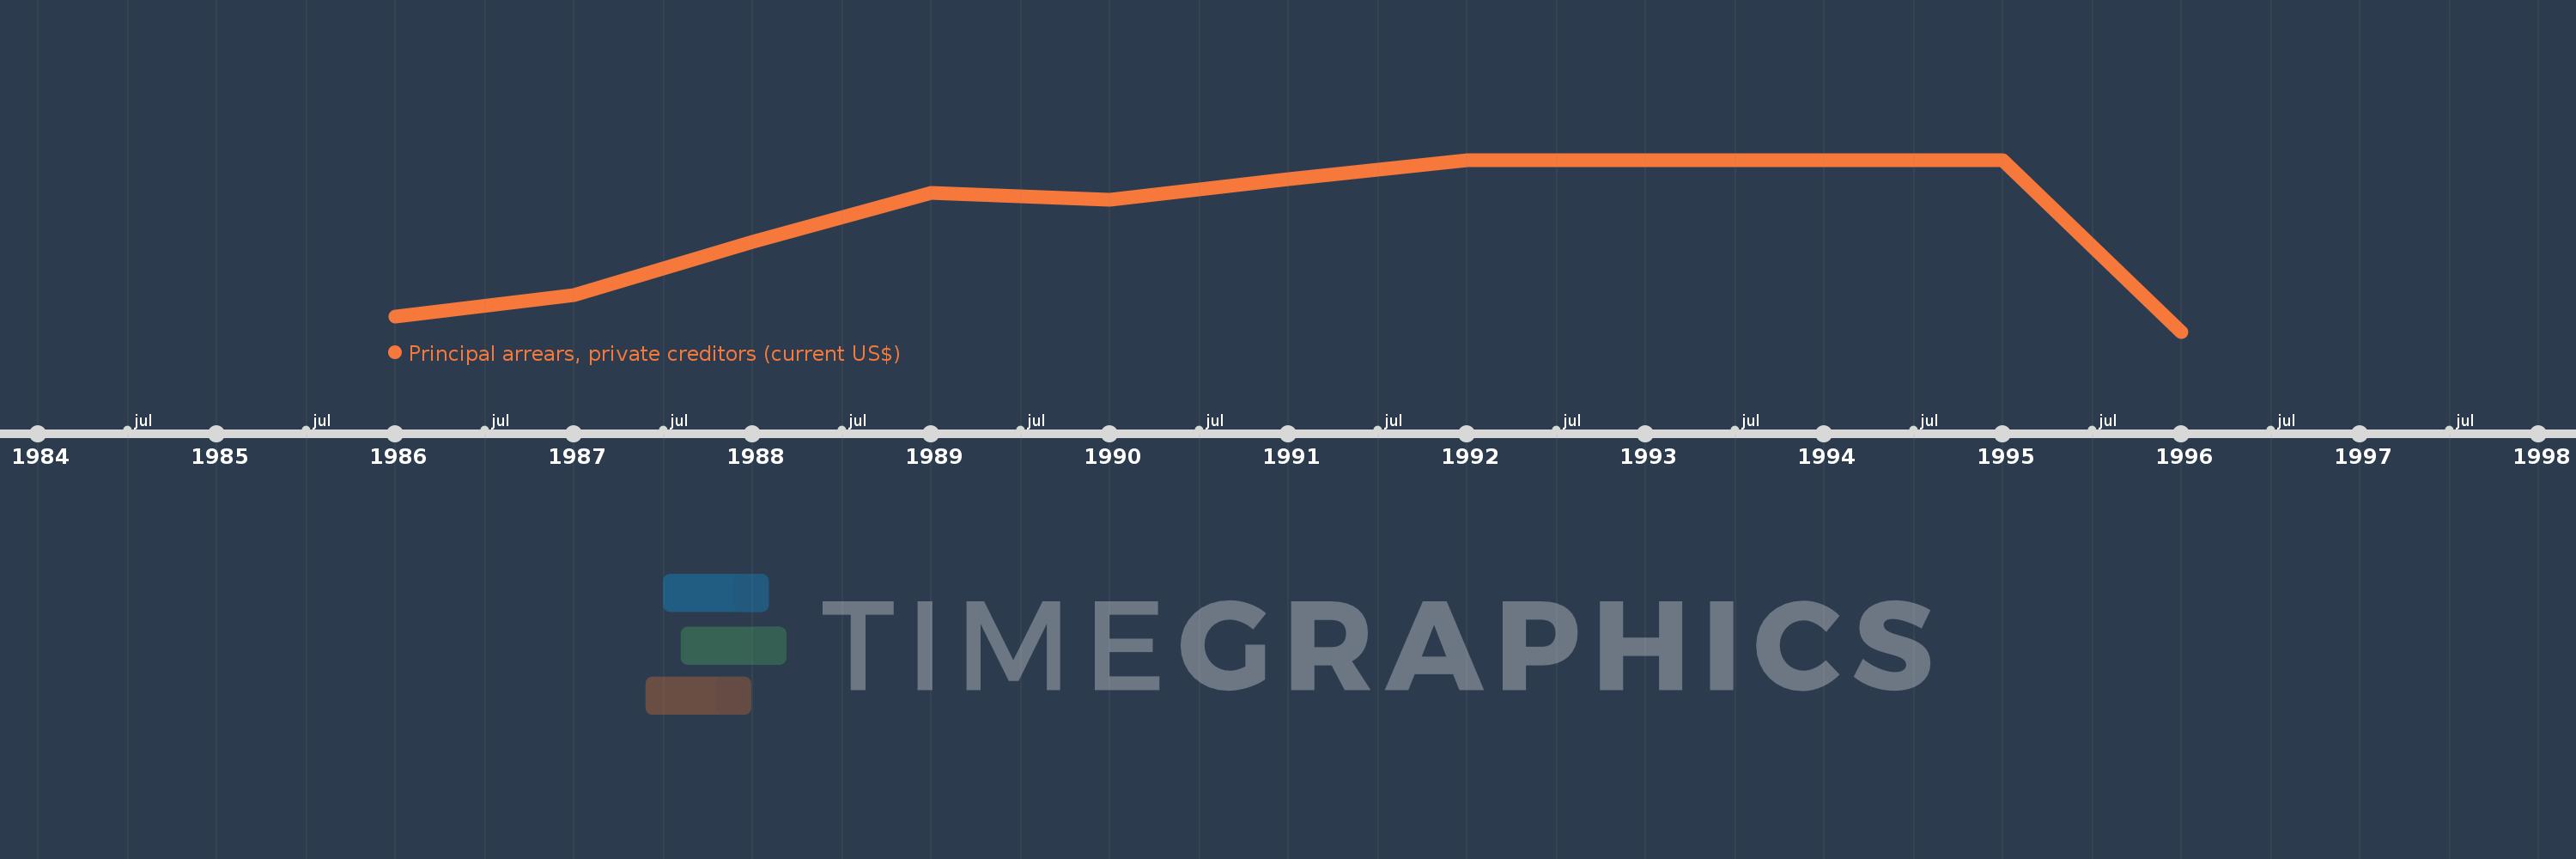
Questa scala temporale mostra un grafico dal 1986 anno al 1996 anno. Sao Tome and Principe. I dati fino ad 1985 anno non disponibili. Il numero di osservazioni attuali secondo i date: 11.
La fonte (nome):
Indicatori dello sviluppo mondiale
La fonte (organizzazione):
World Bank, International Debt Statistics.
Categorie:
External Debt
sono stati aggiornati
23 apr 2017 anni
Indicatori delle variazioni dei valori per anni
In media:
749.455 Mille.
Minima:
0.0
1 gen 1996 anni
Massimo:
1.132 Mln
1 gen 1992 anni
Alla data di osservazione
Valore
Variazione assoluta
La variazione rispetto al valore precedente
1 gen 1986 anni
97.0 Mille.
+97.0 Mille.
0.0%
1 gen 1987 anni
239.0 Mille.
+142.0 Mille.
146.39%
1 gen 1988 anni
589.0 Mille.
+350.0 Mille.
146.44%
1 gen 1989 anni
915.0 Mille.
+326.0 Mille.
55.35%
1 gen 1990 anni
870.0 Mille.
-45.0 Mille.
-4.92%
1 gen 1991 anni
1.006 Mln
+136.0 Mille.
15.63%
1 gen 1992 anni
1.132 Mln
+126.0 Mille.
12.52%
1 gen 1993 anni
1.132 Mln
0.0
0.0%
1 gen 1994 anni
1.132 Mln
0.0
0.0%
1 gen 1995 anni
1.132 Mln
0.0
0.0%
1 gen 1996 anni
0.0
-1.132 Mln
-100.0%
Classificazione dei paesi secondo i statistiche attuali per anni