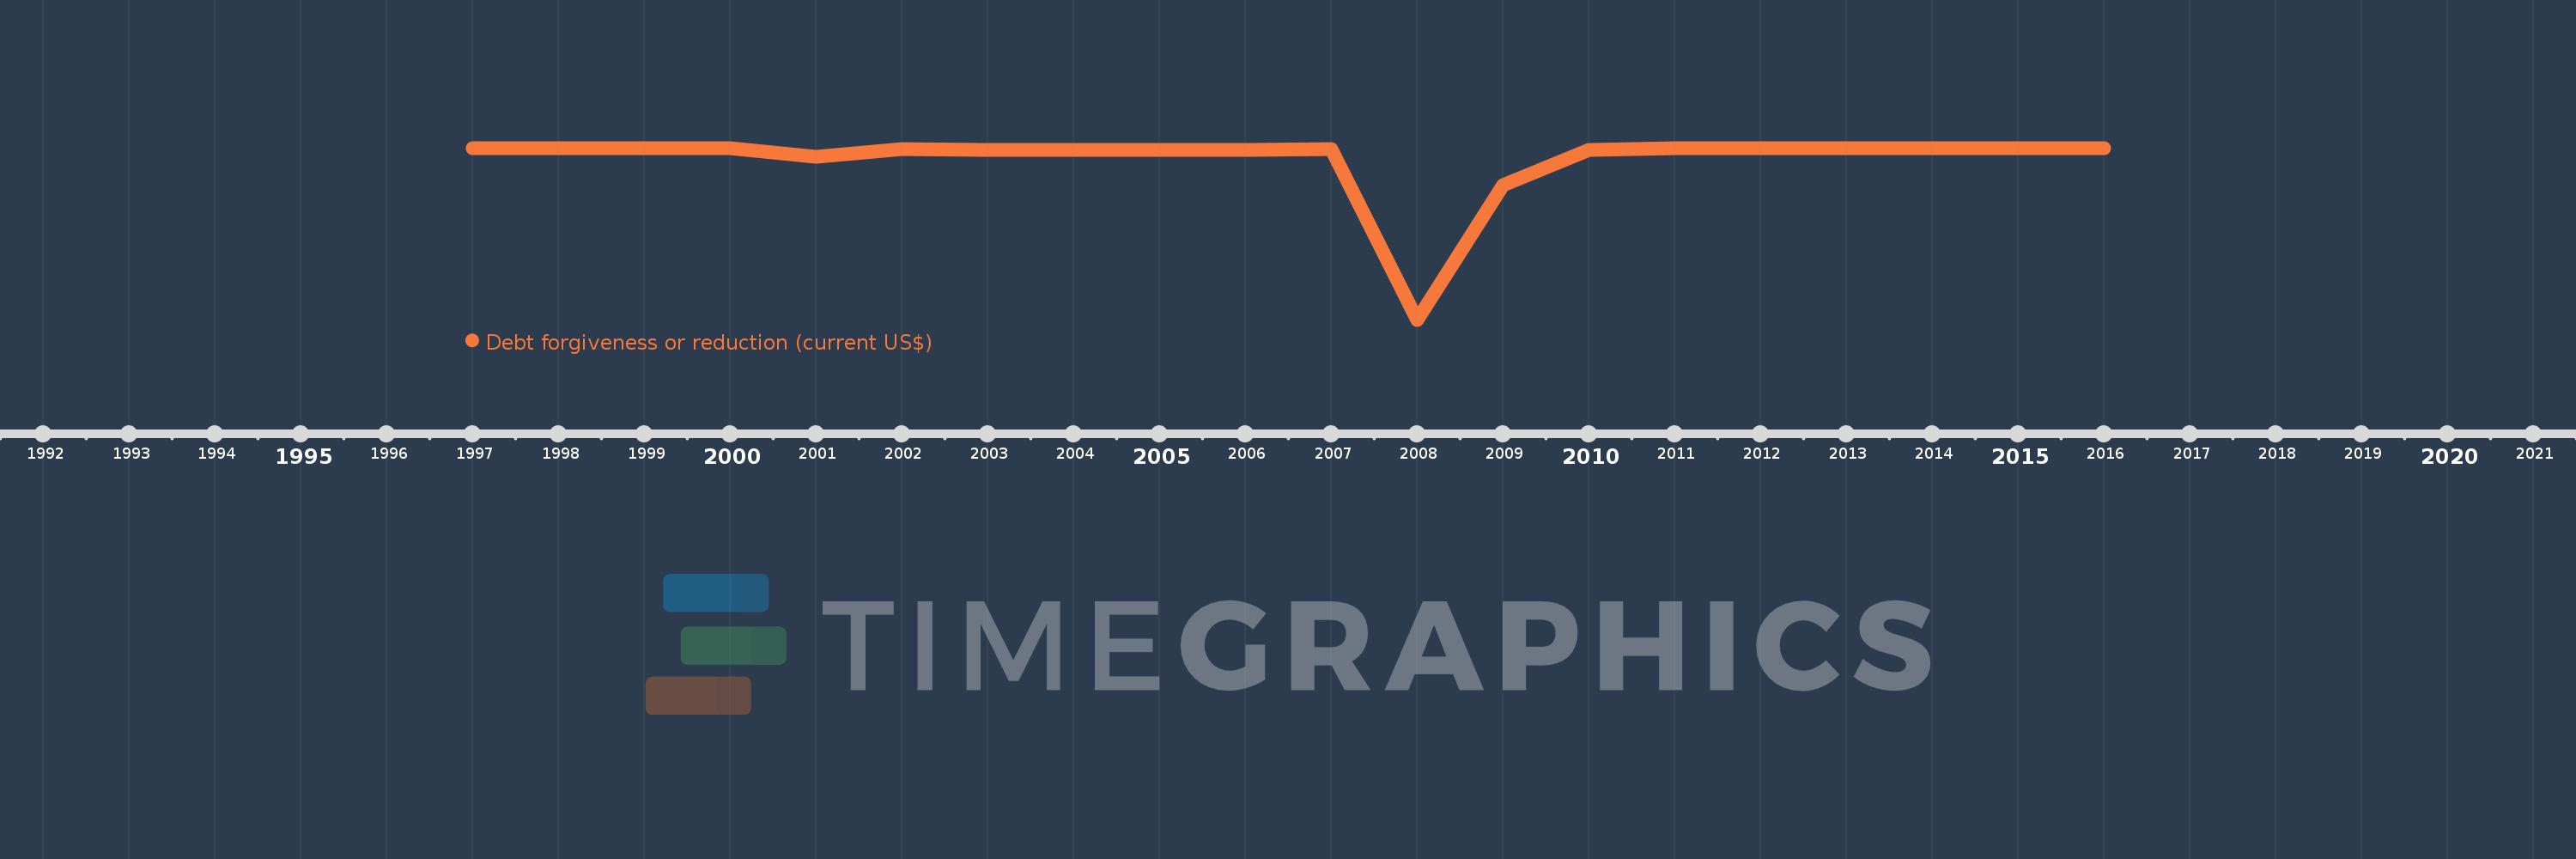
Questa scala temporale mostra un grafico dal 1997 anno al 2016 anno. Sao Tome and Principe. I dati fino ad 1996 anno non disponibili. Il numero di osservazioni attuali secondo i date: 18.
La fonte (nome):
Indicatori dello sviluppo mondiale
La fonte (organizzazione):
World Bank, International Debt Statistics.
Categorie:
External Debt
sono stati aggiornati
23 apr 2017 anni
Indicatori delle variazioni dei valori per anni
In media:
-14.559 Mln
Minima:
-196.194 Mln
1 gen 2008 anni
Massimo:
0.0
1 gen 1997 anni
Alla data di osservazione
Valore
Variazione assoluta
La variazione rispetto al valore precedente
1 gen 1997 anni
0.0
0.0
0.0%
1 gen 2000 anni
0.0
0.0
%
1 gen 2001 anni
-9.684 Mln
-9.684 Mln
%
1 gen 2002 anni
-1.442 Mln
+8.242 Mln
-85.11%
1 gen 2003 anni
-2.108 Mln
-666.0 Mille.
46.19%
1 gen 2004 anni
-2.139 Mln
-31.0 Mille.
1.47%
1 gen 2005 anni
-2.332 Mln
-193.0 Mille.
9.02%
1 gen 2006 anni
-2.53 Mln
-198.0 Mille.
8.49%
1 gen 2007 anni
-1.262 Mln
+1.268 Mln
-50.12%
1 gen 2008 anni
-196.194 Mln
-194.932 Mln
15.45 Mille.%
1 gen 2009 anni
-42.075 Mln
+154.119 Mln
-78.55%
1 gen 2010 anni
-1.931 Mln
+40.144 Mln
-95.41%
1 gen 2011 anni
0.0
+1.931 Mln
-100.0%
1 gen 2012 anni
-71.0 Mille.
-71.0 Mille.
%
1 gen 2013 anni
-65.0 Mille.
+6.0 Mille.
-8.45%
1 gen 2014 anni
-70.0 Mille.
-5.0 Mille.
7.69%
1 gen 2015 anni
-67.0 Mille.
+3.0 Mille.
-4.29%
1 gen 2016 anni
-93.0 Mille.
-26.0 Mille.
38.81%
Classificazione dei paesi secondo i statistiche attuali per anni