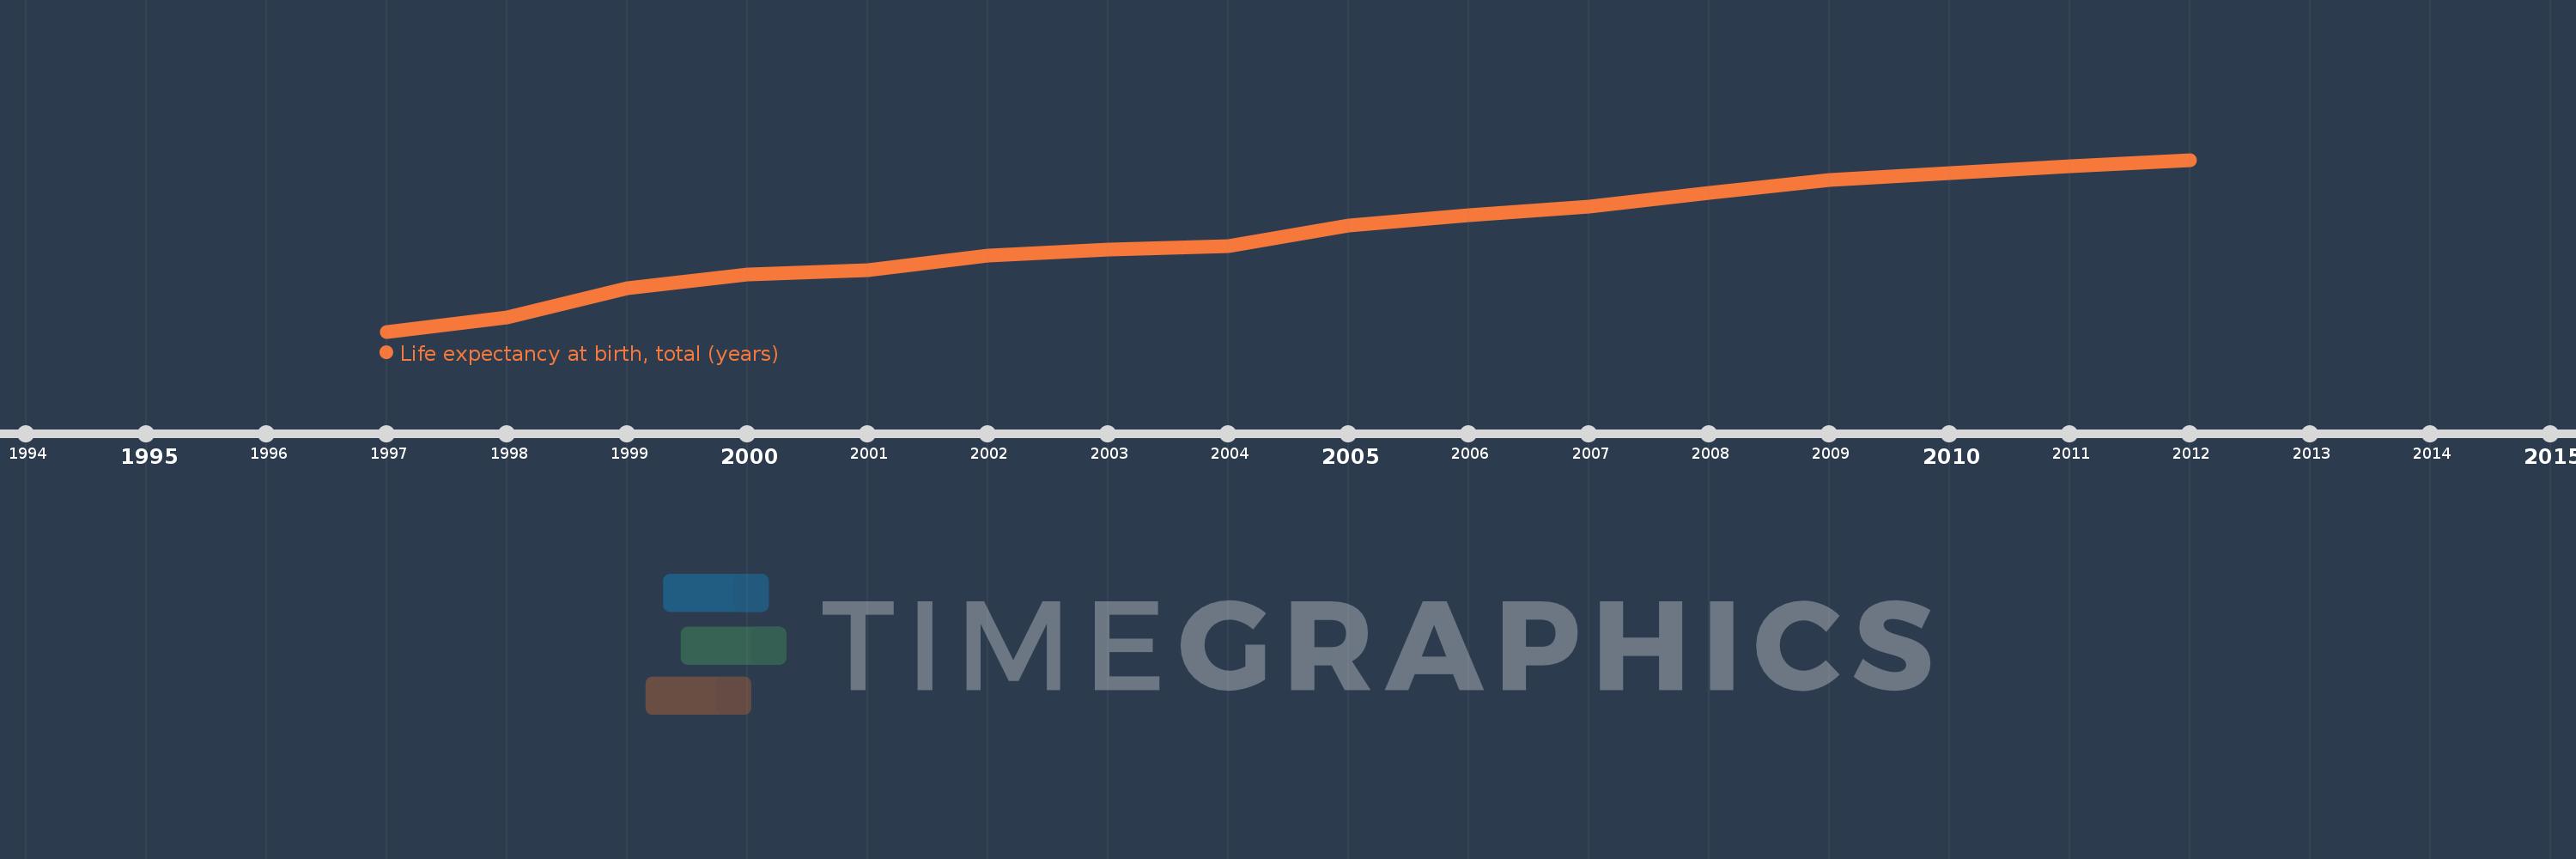
Questa scala temporale mostra un grafico dal 1997 anno al 2012 anno. San Marino. I dati fino ad 1996 anno non disponibili. Il numero di osservazioni attuali secondo i date: 16.
La fonte (nome):
Indicatori dello sviluppo mondiale
La fonte (organizzazione):
Derived from male and female life expectancy at birth from sources such as: (1) United Nations Population Division. World Population Prospects, (2) Census reports and other statistical publications from national statistical offices, (3) Eurostat: Demographic Statistics, (4) United Nations Statistical Division. Population and Vital Statistics Reprot (various years), (5) U.S. Census Bureau: International Database, and (6) Secretariat of the Pacific Community: Statistics and Demography Programme.
Categorie:
Health
sono stati aggiornati
23 apr 2017 anni
Indicatori delle variazioni dei valori per anni
In media:
81.495
Minima:
79.12
1 gen 1997 anni
Massimo:
83.323
1 gen 2012 anni
Alla data di osservazione
Valore
Variazione assoluta
La variazione rispetto al valore precedente
1 gen 1997 anni
79.12
+79.12
0.0%
1 gen 1998 anni
79.473
+0.354
0.45%
1 gen 1999 anni
80.173
+0.7
0.88%
1 gen 2000 anni
80.524
+0.351
0.44%
1 gen 2001 anni
80.62
+0.095
0.12%
1 gen 2002 anni
80.973
+0.354
0.44%
1 gen 2003 anni
81.12
+0.146
0.18%
1 gen 2004 anni
81.22
+0.1
0.12%
1 gen 2005 anni
81.722
+0.502
0.62%
1 gen 2006 anni
81.976
+0.254
0.31%
1 gen 2007 anni
82.18
+0.205
0.25%
1 gen 2008 anni
82.506
+0.326
0.4%
1 gen 2009 anni
82.832
+0.326
0.39%
1 gen 2010 anni
82.996
+0.164
0.2%
1 gen 2011 anni
83.159
+0.164
0.2%
1 gen 2012 anni
83.323
+0.164
0.2%
Classificazione dei paesi secondo i statistiche attuali per anni