33
/it/
AIzaSyB4mHJ5NPEv-XzF7P6NDYXjlkCWaeKw5bc
November 30, 2025
231760
Rwanda
RWA
true
2
1
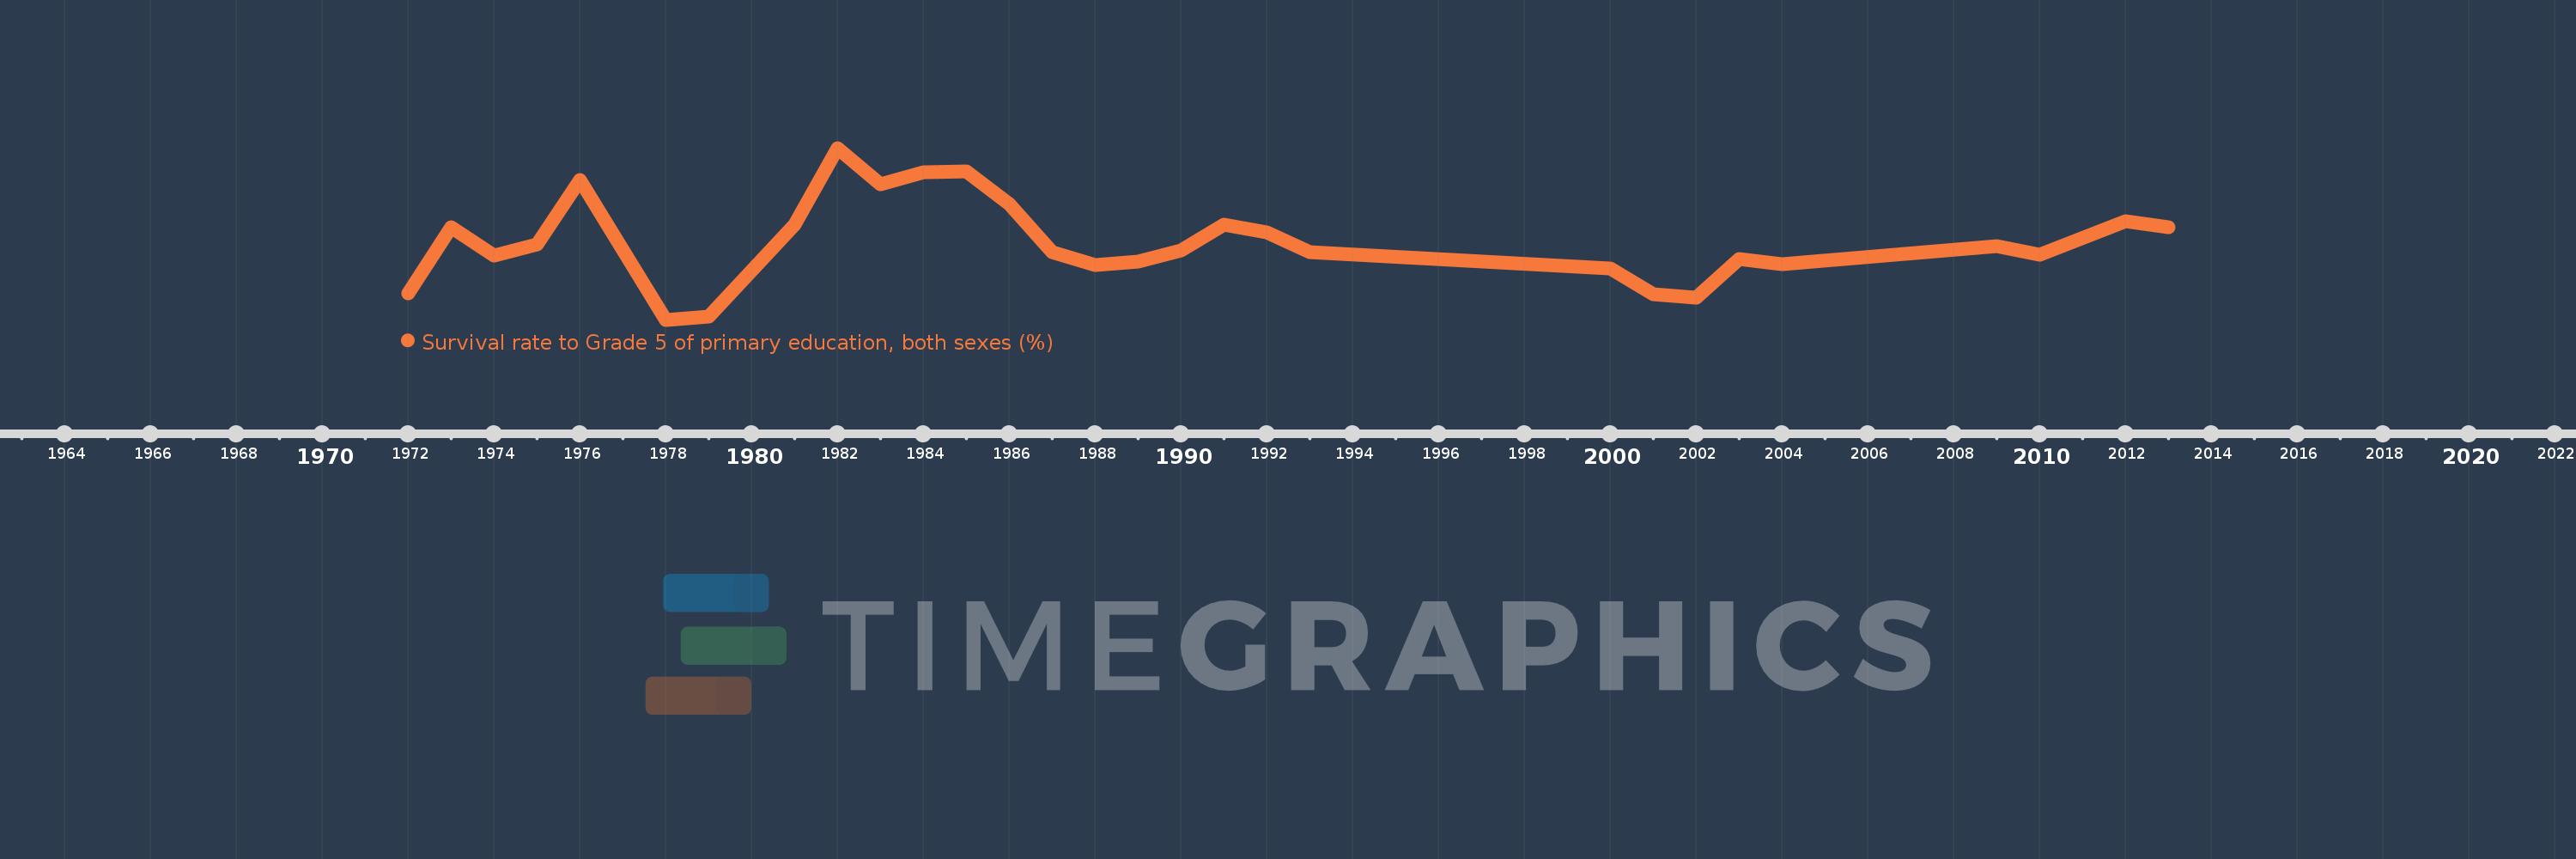
Survival rate to Grade 5 of primary education, both sexes (%)
2013,2012,2010,2009,2004,2003,2002,2001,2000,1993,1992,1991,1990,1989,1988,1987,1986,1985,1984,1983,1982,1981,1979,1978,1976,1975,1974,1973,1972