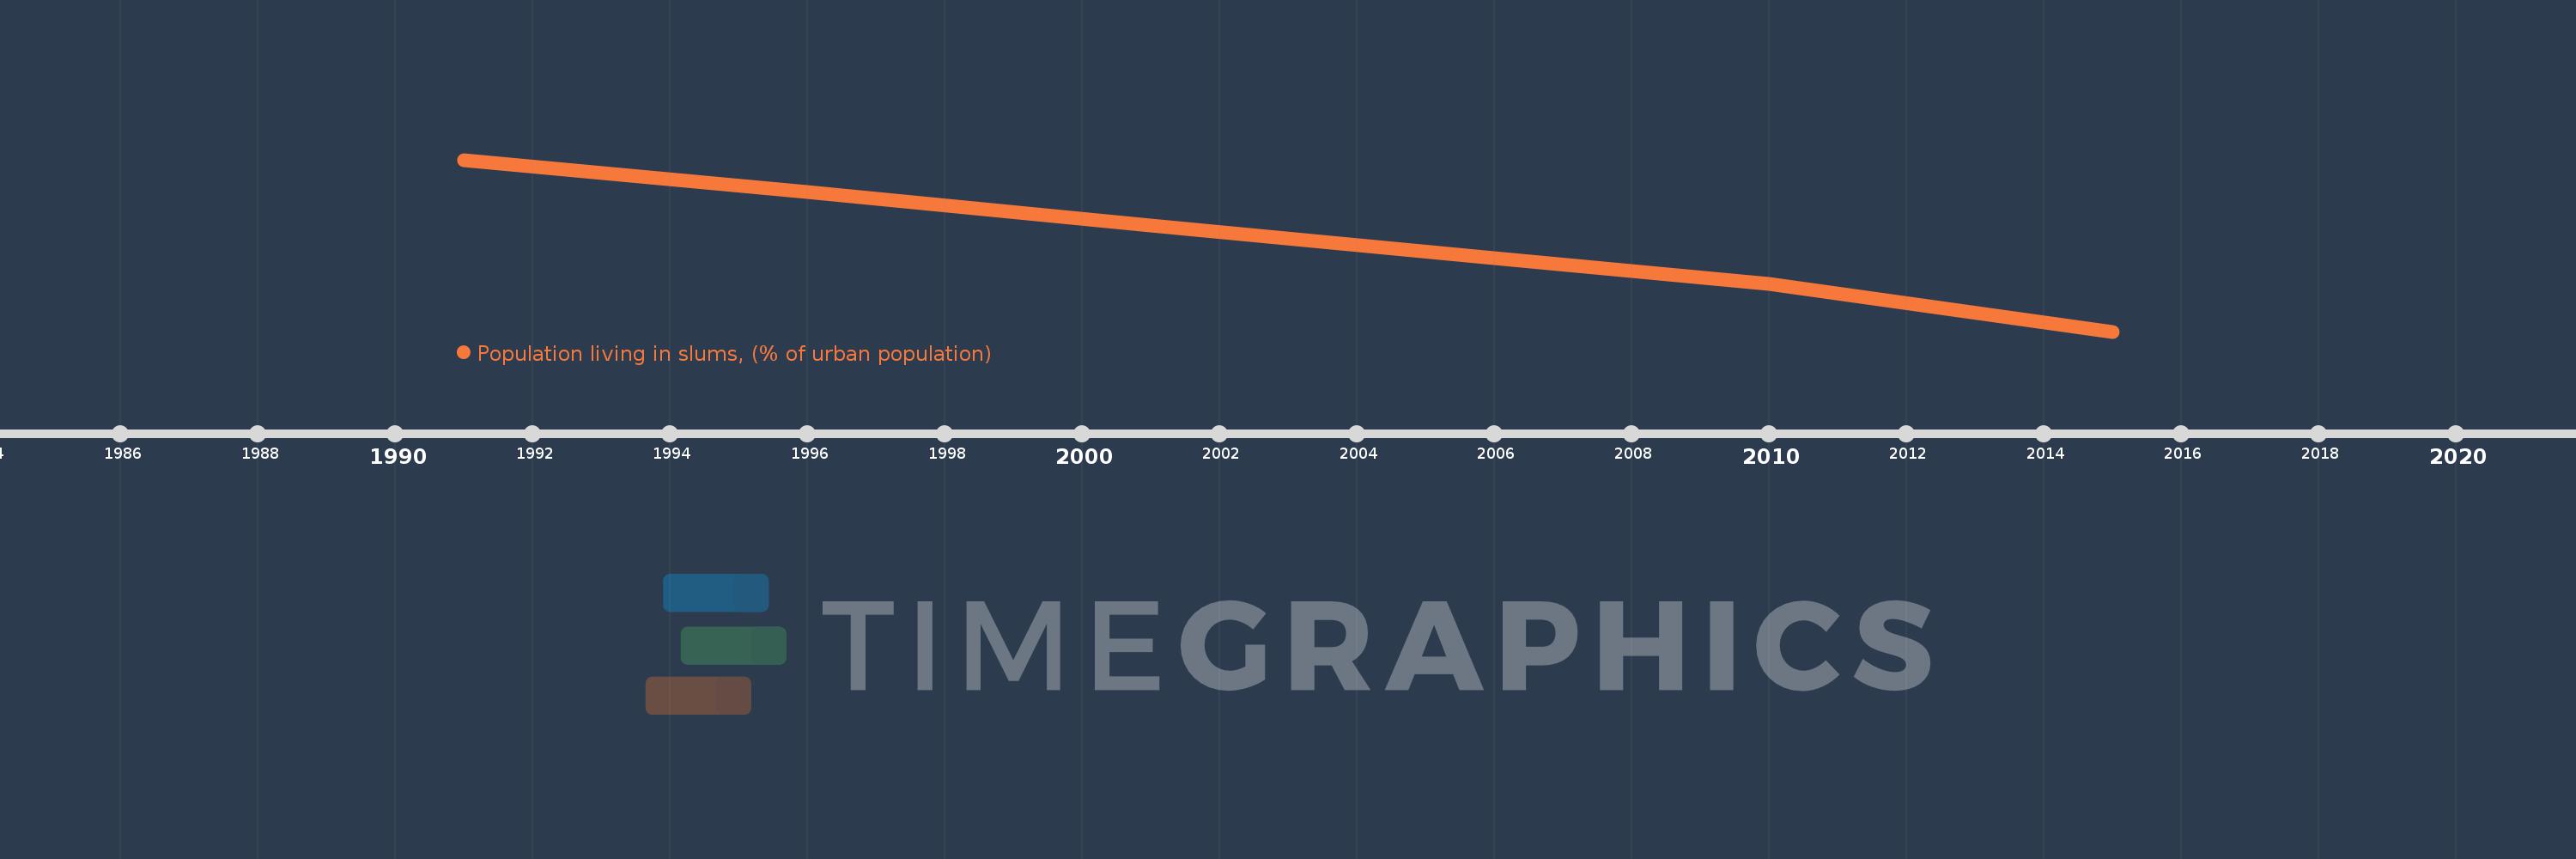
Questa scala temporale mostra un grafico dal 1991 anno al 2015 anno. Rwanda. I dati fino ad 1990 anno non disponibili. Il numero di osservazioni attuali secondo i date: 7.
La fonte (nome):
Indicatori dello sviluppo mondiale
La fonte (organizzazione):
UN HABITAT, retrieved from the United Nation's Millennium Development Goals database. Data are available at: Http://mdgs.un.org
Categorie:
Poverty, Urban Development, Environment
sono stati aggiornati
23 apr 2017 anni
Indicatori delle variazioni dei valori per anni
In media:
74.543
Minima:
53.2
1 gen 2015 anni
Massimo:
96.0
1 gen 1991 anni
Alla data di osservazione
Valore
Variazione assoluta
La variazione rispetto al valore precedente
1 gen 1991 anni
96.0
+96.0
0.0%
1 gen 1996 anni
87.9
-8.1
-8.44%
1 gen 2001 anni
79.7
-8.2
-9.33%
1 gen 2006 anni
71.6
-8.1
-10.16%
1 gen 2008 anni
68.3
-3.3
-4.61%
1 gen 2010 anni
65.1
-3.2
-4.69%
1 gen 2015 anni
53.2
-11.9
-18.28%
Classificazione dei paesi secondo i statistiche attuali per anni