29
/it/
it
AIzaSyAYiBZKx7MnpbEhh9jyipgxe19OcubqV5w
April 1, 2024
228924
Romania
ROU
true
2
1
Other expense (% of expense)
2015,2014,2013,2012,2011,2010,2009,2008,2007,2006,2005,2004,2003,2002,2001,2000,1999,1998,1997,1996,1995,1994,1993,1992,1991
Download
Biblioteca di statistiche globali →Romania →

Other expense (% of expense)

Queste statistiche in altri paesi:
AfghanistanAlbaniaAlgeriaAngolaArab WorldArmeniaAustraliaAustriaAzerbaijanBahrainBangladeshBarbadosBelarusBelgiumBelizeBeninBhutanBoliviaBosnia and HerzegovinaBotswanaBrazilBulgariaBurkina FasoBurundiCabo VerdeCambodiaCanadaCaribbean small statesCentral African RepublicCentral Europe and the BalticsChileColombiaCongo, Dem. Rep.Congo, Rep.Costa RicaCote d'IvoireCroatiaCyprusCzech RepublicDenmarkDominican RepublicEarly-demographic dividendEast Asia & PacificEast Asia & Pacific (excluding high income)East Asia & Pacific (IDA & IBRD countries)Egypt, Arab Rep.El SalvadorEquatorial GuineaEstoniaEthiopiaEuro areaEurope & Central AsiaEurope & Central Asia (excluding high income)Europe & Central Asia (IDA & IBRD countries)European UnionFijiFinlandFranceGambia, TheGeorgiaGermanyGhanaGreeceGrenadaGuatemalaHeavily indebted poor countries (HIPC)High incomeHondurasHong Kong SAR, ChinaHungaryIBRD onlyIcelandIDA & IBRD totalIDA onlyIDA totalIndiaIndonesiaIran, Islamic Rep.IraqIrelandIsraelItalyJamaicaJapanJordanKazakhstanKenyaKiribatiKorea, Rep.KuwaitKyrgyz RepublicLao PDRLate-demographic dividendLatin America & Caribbean Latin America & Caribbean (excluding high income)Latin America & the Caribbean (IDA & IBRD countries)LatviaLeast developed countries: UN classificationLebanonLesothoLithuaniaLow & middle incomeLow incomeLower middle incomeLuxembourgMacao SAR, ChinaMacedonia, FYRMadagascarMalawiMalaysiaMaldivesMaliMaltaMauritiusMicronesia, Fed. Sts.Middle East & North AfricaMiddle East & North Africa (excluding high income)Middle East & North Africa (IDA & IBRD countries)Middle incomeMoldovaMongoliaMoroccoMozambiqueNamibiaNepalNetherlandsNew ZealandNicaraguaNorth AmericaNorwayOECD membersOmanOther small statesPakistanPanamaPapua New GuineaParaguayPeruPhilippinesPolandPortugalPost-demographic dividendPre-demographic dividendQatarRomaniaRussian FederationRwandaSamoaSan MarinoSao Tome and PrincipeSerbiaSeychellesSierra LeoneSlovak RepublicSloveniaSmall statesSolomon IslandsSouth AfricaSouth AsiaSouth Asia (IDA & IBRD)SpainSri LankaSub-Saharan Africa Sub-Saharan Africa (excluding high income)Sub-Saharan Africa (IDA & IBRD countries)SurinameSwazilandSwedenSwitzerlandTajikistanTanzaniaThailandTimor-LesteTogoTrinidad and TobagoTunisiaTurkeyUgandaUkraineUnited Arab EmiratesUnited KingdomUnited StatesUpper middle incomeUruguayVanuatuVenezuela, RBWest Bank and GazaWorldYemen, Rep.Zambia
Linea del tempo:
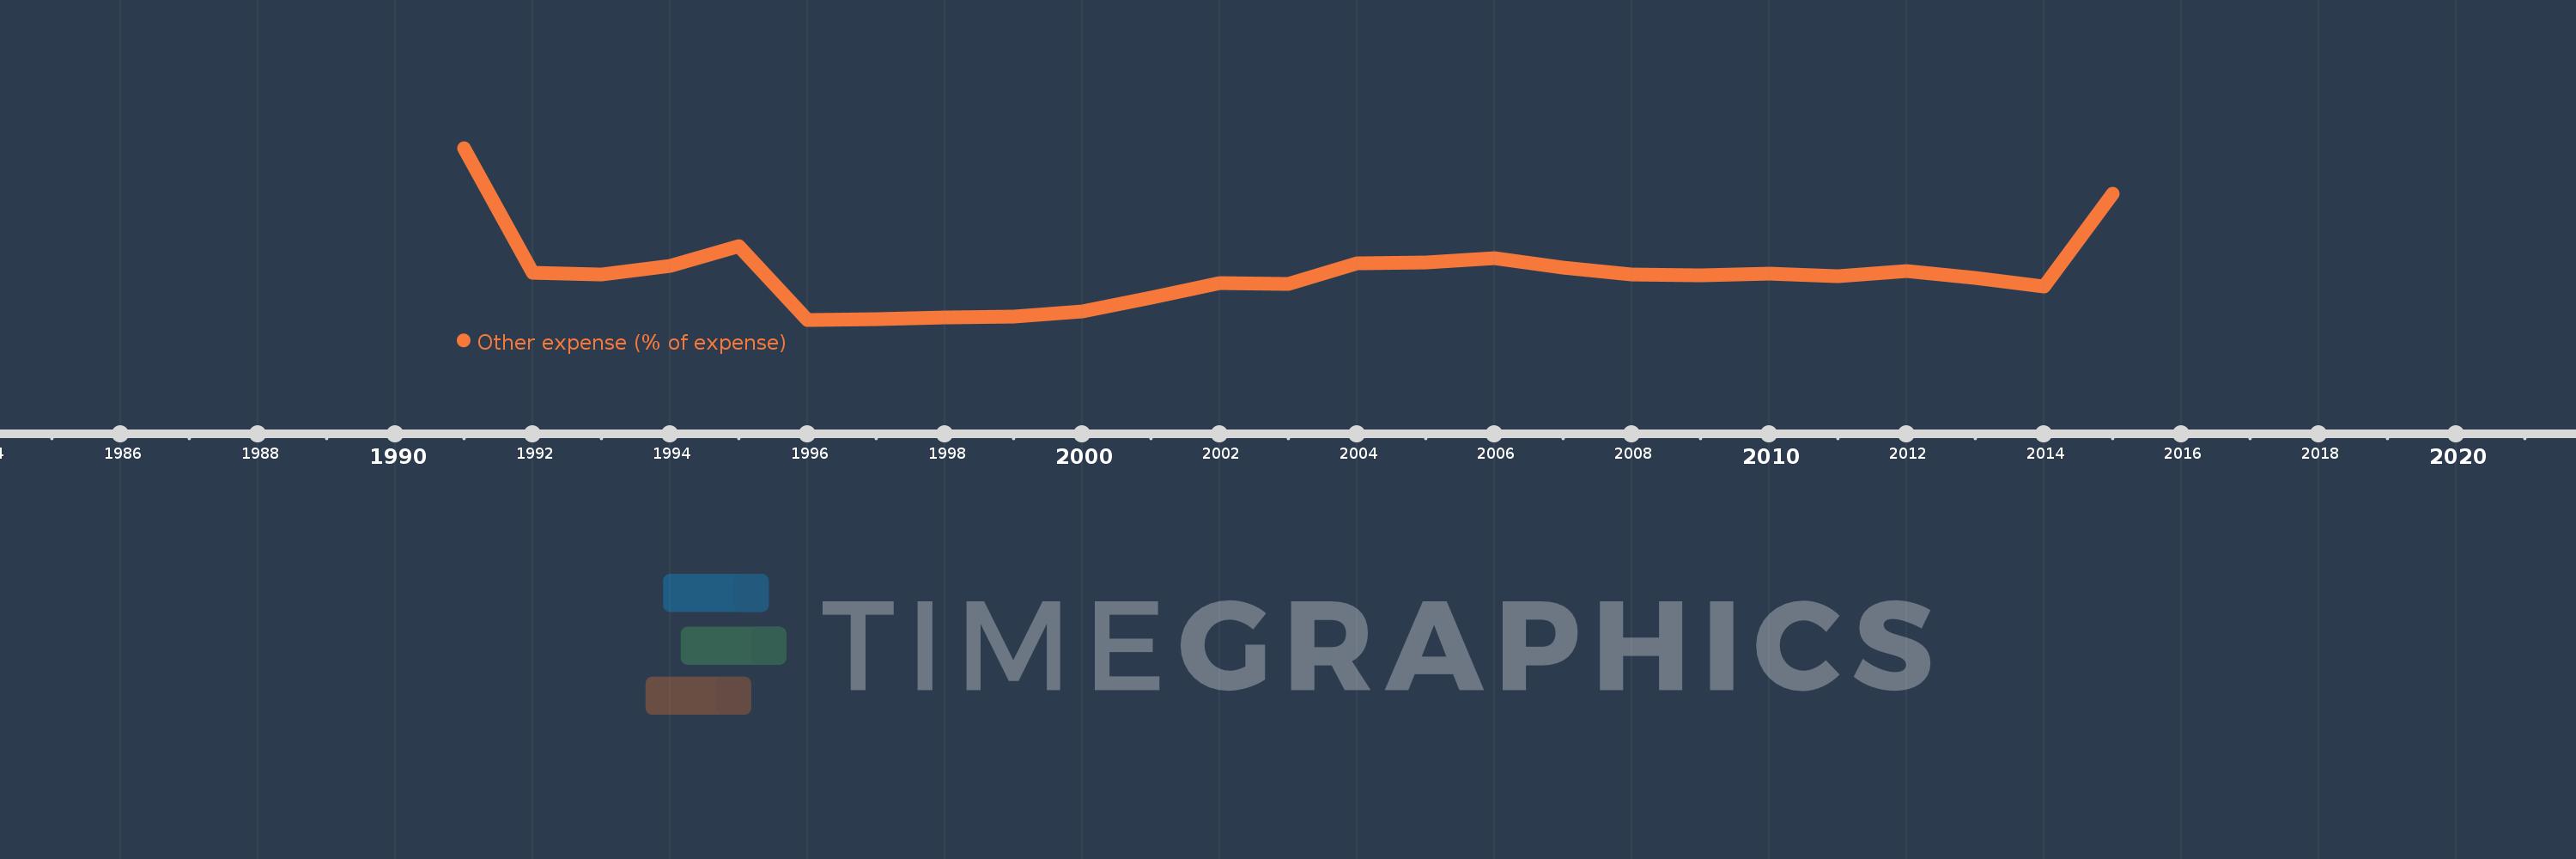
Questa scala temporale mostra un grafico dal 1991 anno al 2015 anno. Romania. I dati fino ad 1990 anno non disponibili. Il numero di osservazioni attuali secondo i date: 25.
La fonte (nome):
Indicatori dello sviluppo mondiale
La fonte (organizzazione):
International Monetary Fund, Government Finance Statistics Yearbook and data files.
Categorie:
Public Sector
sono stati aggiornati
23 apr 2017 anni
Indicatori delle variazioni dei valori per anni
In media:
4.531
Minima:
0.21
1 gen 1996 anni
Massimo:
16.224
1 gen 1991 anni
Alla data di osservazione
Valore
Variazione assoluta
La variazione rispetto al valore precedente
1 gen 1991 anni
16.224
+16.224
0.0%
1 gen 1992 anni
4.591
-11.633
-71.7%
1 gen 1993 anni
4.443
-0.148
-3.22%
1 gen 1994 anni
5.238
+0.795
17.89%
1 gen 1995 anni
7.065
+1.827
34.88%
1 gen 1996 anni
0.21
-6.856
-97.03%
1 gen 1997 anni
0.306
+0.096
45.79%
1 gen 1998 anni
0.424
+0.118
38.61%
1 gen 1999 anni
0.529
+0.105
24.72%
1 gen 2000 anni
0.989
+0.461
87.12%
1 gen 2001 anni
2.23
+1.241
125.4%
1 gen 2002 anni
3.631
+1.401
62.83%
1 gen 2003 anni
3.584
-0.047
-1.3%
1 gen 2004 anni
5.494
+1.91
53.3%
1 gen 2005 anni
5.562
+0.068
1.24%
1 gen 2006 anni
5.949
+0.388
6.97%
1 gen 2007 anni
5.096
-0.854
-14.35%
1 gen 2008 anni
4.416
-0.68
-13.34%
1 gen 2009 anni
4.364
-0.052
-1.17%
1 gen 2010 anni
4.476
+0.112
2.56%
1 gen 2011 anni
4.273
-0.203
-4.54%
1 gen 2012 anni
4.726
+0.454
10.62%
1 gen 2013 anni
4.128
-0.599
-12.67%
1 gen 2014 anni
3.348
-0.78
-18.9%
1 gen 2015 anni
11.977
+8.629
257.77%
Classificazione dei paesi secondo i statistiche attuali per anni

Commenti:

Inviare
PremiumAbout & FeedbackAccordoPrivatezza
logo
© 2022 Selected Technologies LLC – Morgan Hill, California