33
/it/
AIzaSyAYiBZKx7MnpbEhh9jyipgxe19OcubqV5w
August 1, 2025
228239
Romania
ROU
true
2
1
Coal rents (% of GDP)
2016,2015,2014,2013,2012,2011,2010,2009,2008,2007,2006,2005,2004,2003,2002,2001,2000,1999,1998,1997,1996,1995,1994,1993,1992,1991,1990,1989,1988
Download
Biblioteca di statistiche globali →Romania →

Coal rents (% of GDP)

Queste statistiche in altri paesi:

AfghanistanAlbaniaAlgeriaAngolaAntigua and BarbudaArab WorldArgentinaArmeniaArubaAustraliaAustriaAzerbaijanBahamas, TheBahrainBangladeshBarbadosBelarusBelgiumBelizeBeninBermudaBhutanBoliviaBosnia and HerzegovinaBotswanaBrazilBrunei DarussalamBulgariaBurkina FasoBurundiCabo VerdeCambodiaCameroonCanadaCaribbean small statesCayman IslandsCentral African RepublicCentral Europe and the BalticsChadChileChinaColombiaComorosCongo, Dem. Rep.Congo, Rep.Costa RicaCote d'IvoireCroatiaCubaCyprusCzech RepublicDenmarkDjiboutiDominicaDominican RepublicEarly-demographic dividendEast Asia & PacificEast Asia & Pacific (excluding high income)East Asia & Pacific (IDA & IBRD countries)EcuadorEgypt, Arab Rep.El SalvadorEquatorial GuineaEritreaEstoniaEthiopiaEuro areaEurope & Central AsiaEurope & Central Asia (excluding high income)Europe & Central Asia (IDA & IBRD countries)European UnionFijiFinlandFragile and conflict affected situationsFranceFrench PolynesiaGabonGambia, TheGeorgiaGermanyGhanaGreeceGreenlandGrenadaGuatemalaGuineaGuinea-BissauGuyanaHaitiHeavily indebted poor countries (HIPC)High incomeHondurasHong Kong SAR, ChinaHungaryIBRD onlyIcelandIDA & IBRD totalIDA blendIDA onlyIDA totalIndiaIndonesiaIran, Islamic Rep.IraqIrelandIsraelItalyJamaicaJapanJordanKazakhstanKenyaKiribatiKorea, Rep.KosovoKuwaitKyrgyz RepublicLao PDRLate-demographic dividendLatin America & Caribbean Latin America & Caribbean (excluding high income)Latin America & the Caribbean (IDA & IBRD countries)LatviaLeast developed countries: UN classificationLebanonLesothoLiberiaLibyaLithuaniaLow & middle incomeLow incomeLower middle incomeLuxembourgMacao SAR, ChinaMacedonia, FYRMadagascarMalawiMalaysiaMaldivesMaliMaltaMauritaniaMauritiusMexicoMiddle East & North AfricaMiddle East & North Africa (excluding high income)Middle East & North Africa (IDA & IBRD countries)Middle incomeMoldovaMongoliaMontenegroMoroccoMozambiqueMyanmarNamibiaNepalNetherlandsNew CaledoniaNew ZealandNicaraguaNigerNigeriaNorth AmericaNorwayOECD membersOmanOther small statesPacific island small statesPakistanPanamaPapua New GuineaParaguayPeruPhilippinesPolandPortugalPost-demographic dividendPre-demographic dividendPuerto RicoQatarRomaniaRussian FederationRwandaSamoaSao Tome and PrincipeSaudi ArabiaSenegalSerbiaSeychellesSierra LeoneSingaporeSlovak RepublicSloveniaSmall statesSolomon IslandsSouth AfricaSouth AsiaSouth Asia (IDA & IBRD)SpainSri LankaSt. Kitts and NevisSt. LuciaSt. Vincent and the GrenadinesSub-Saharan Africa Sub-Saharan Africa (excluding high income)Sub-Saharan Africa (IDA & IBRD countries)SudanSurinameSwazilandSwedenSwitzerlandSyrian Arab RepublicTajikistanTanzaniaThailandTimor-LesteTogoTongaTrinidad and TobagoTunisiaTurkeyTurkmenistanUgandaUkraineUnited Arab EmiratesUnited KingdomUnited StatesUpper middle incomeUruguayUzbekistanVanuatuVenezuela, RBVietnamVirgin Islands (U.S.)West Bank and GazaWorldYemen, Rep.ZambiaZimbabwe

Linea del tempo:

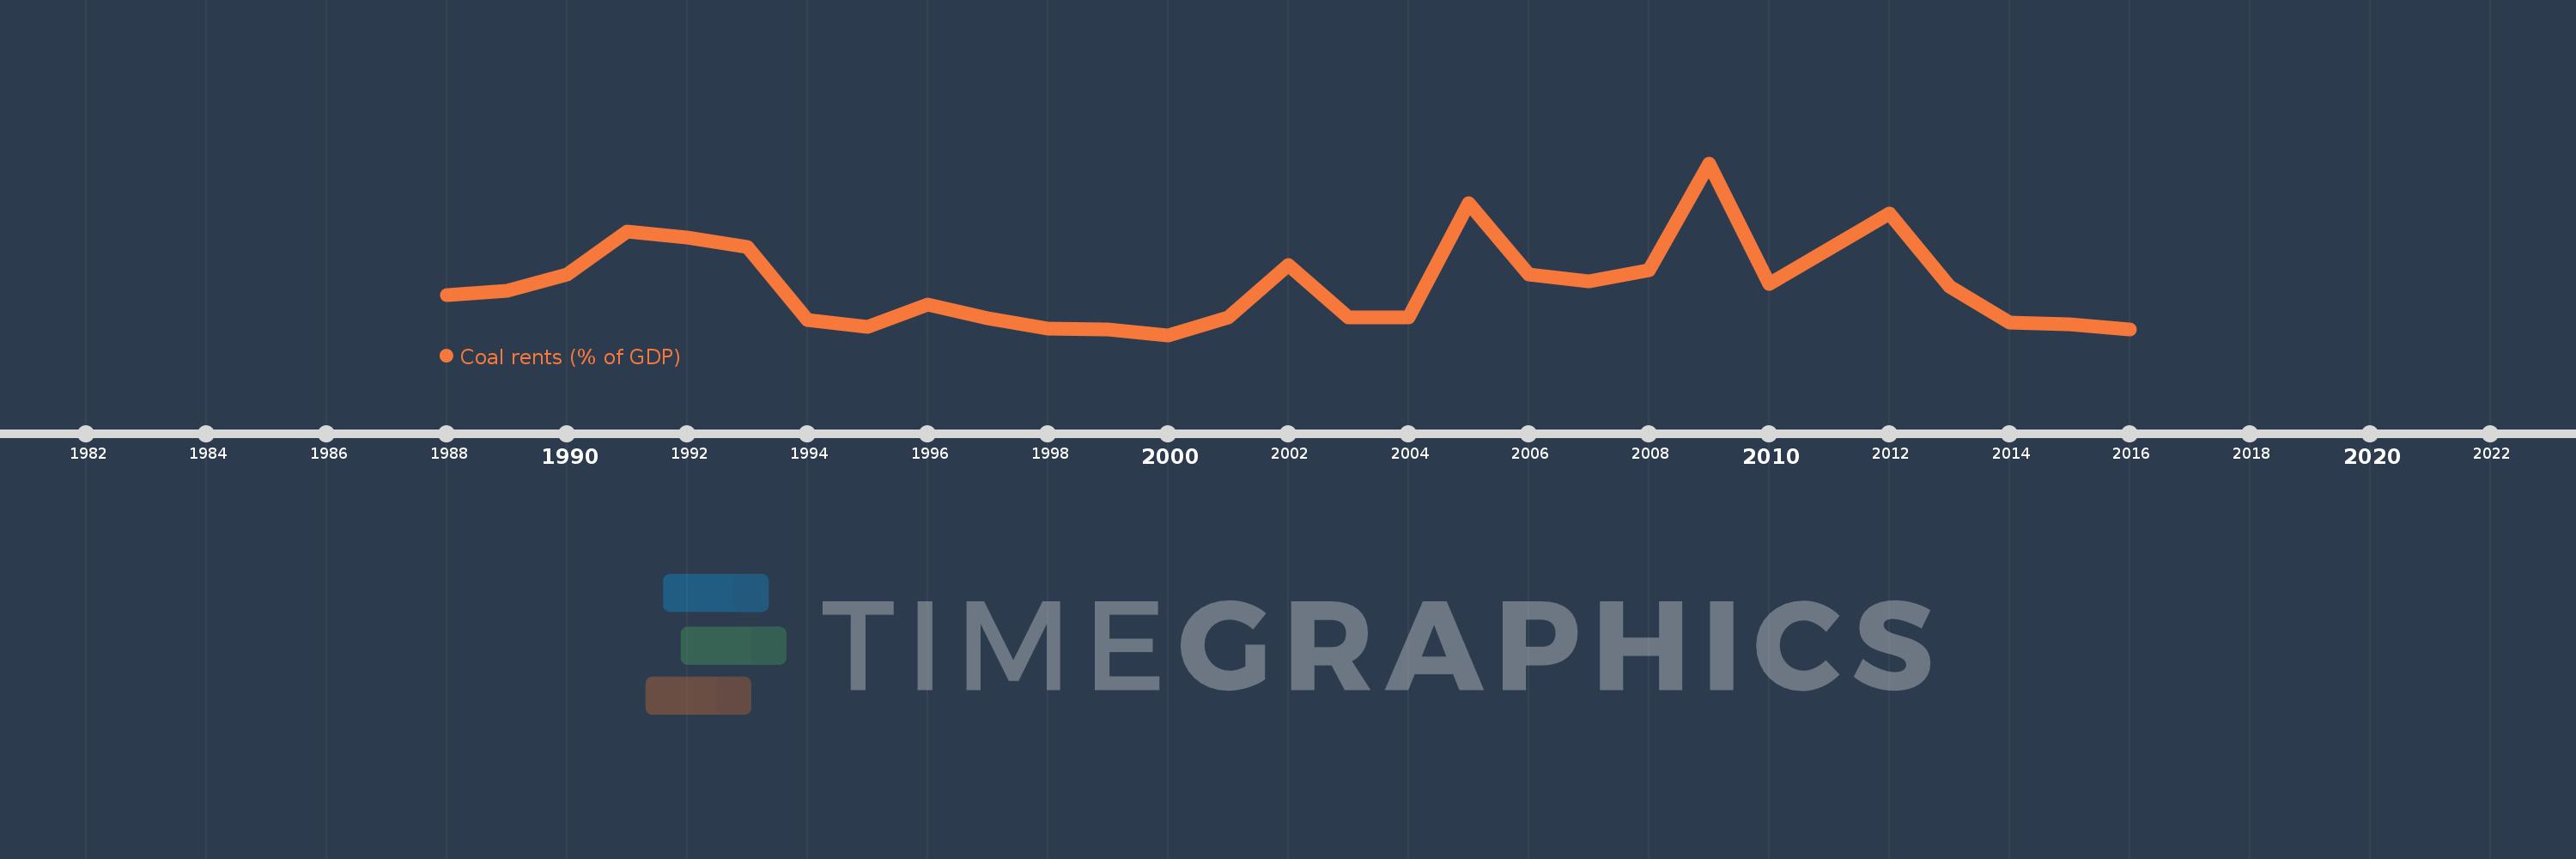
Questa scala temporale mostra un grafico dal 1988 anno al 2016 anno. Romania. I dati fino ad 1987 anno non disponibili. Il numero di osservazioni attuali secondo i date: 29.

La fonte (nome):

Indicatori dello sviluppo mondiale

La fonte (organizzazione):

Estimates based on sources and methods described in "The Changing Wealth of Nations: Measuring Sustainable Development in the New Millennium" (World Bank, 2011).

Categorie:

Environment

sono stati aggiornati

23 apr 2017 anni

Indicatori delle variazioni dei valori per anni

In media:
0.124
Minima:
0.006
1 gen 2000 anni
Massimo:
0.41
1 gen 2009 anni
Alla data di osservazione
Valore
Variazione assoluta
La variazione rispetto al valore precedente
1 gen 1988 anni
0.099
+0.099
0.0%
1 gen 1989 anni
0.111
+0.012
12.07%
1 gen 1990 anni
0.148
+0.037
33.79%
1 gen 1991 anni
0.25
+0.102
69.1%
1 gen 1992 anni
0.235
-0.016
-6.32%
1 gen 1993 anni
0.214
-0.021
-8.77%
1 gen 1994 anni
0.042
-0.172
-80.45%
1 gen 1995 anni
0.026
-0.016
-37.07%
1 gen 1996 anni
0.077
+0.051
192.62%
1 gen 1997 anni
0.045
-0.032
-41.12%
1 gen 1998 anni
0.022
-0.023
-50.67%
1 gen 1999 anni
0.02
-0.002
-8.59%
1 gen 2000 anni
0.006
-0.014
-69.53%
1 gen 2001 anni
0.047
+0.041
654.06%
1 gen 2002 anni
0.17
+0.123
260.91%
1 gen 2003 anni
0.048
-0.121
-71.41%
1 gen 2004 anni
0.048
-0.001
-1.69%
1 gen 2005 anni
0.317
+0.27
565.9%
1 gen 2006 anni
0.148
-0.17
-53.44%
1 gen 2007 anni
0.133
-0.015
-10.08%
1 gen 2008 anni
0.158
+0.025
19.1%
1 gen 2009 anni
0.41
+0.252
159.34%
1 gen 2010 anni
0.127
-0.283
-68.96%
1 gen 2011 anni
0.209
+0.081
63.7%
1 gen 2012 anni
0.292
+0.083
39.81%
1 gen 2013 anni
0.12
-0.171
-58.67%
1 gen 2014 anni
0.036
-0.085
-70.15%
1 gen 2015 anni
0.031
-0.005
-13.69%
1 gen 2016 anni
0.02
-0.011
-35.6%

Classificazione dei paesi secondo i statistiche attuali per anni