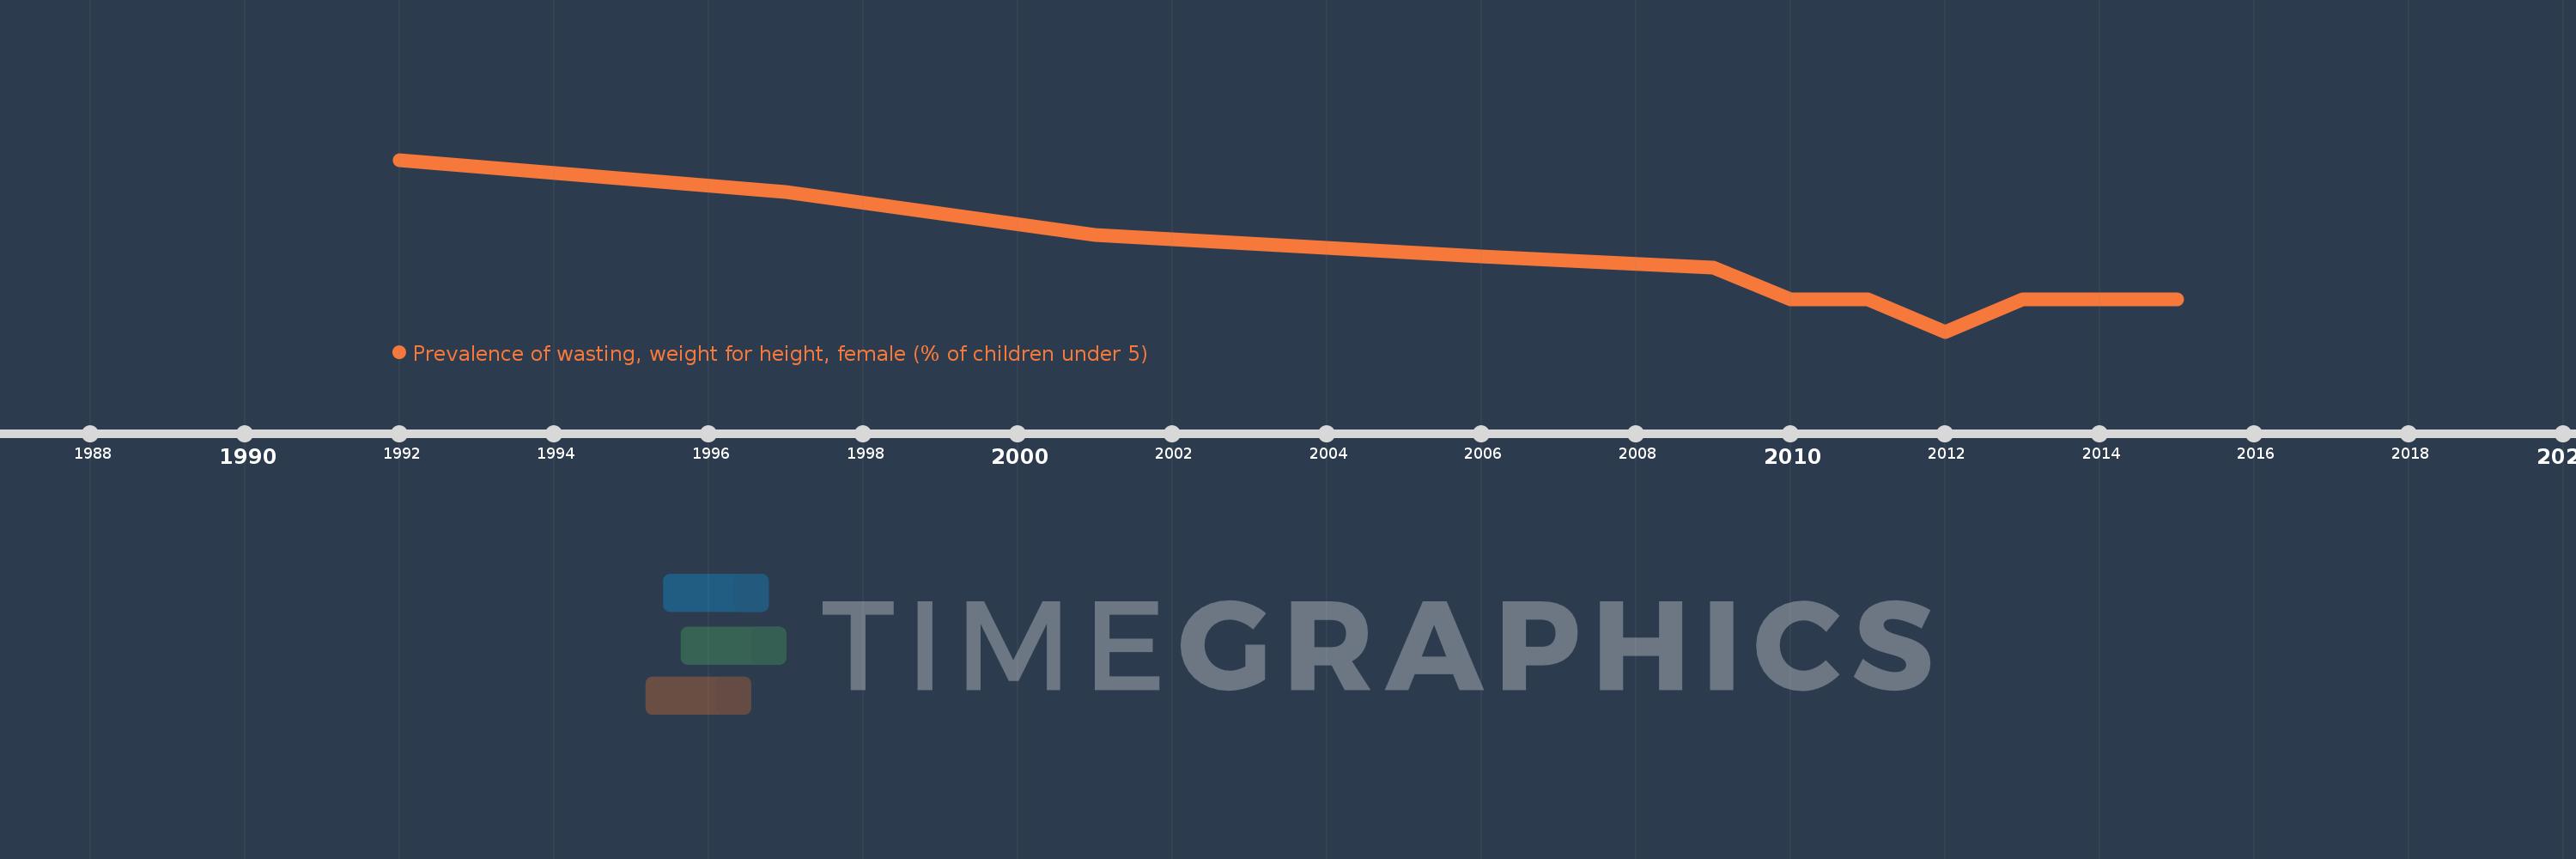
Questa scala temporale mostra un grafico dal 1992 anno al 2015 anno. Peru. I dati fino ad 1991 anno non disponibili. Il numero di osservazioni attuali secondo i date: 10.
La fonte (nome):
Indicatori dello sviluppo mondiale
La fonte (organizzazione):
World Health Organization, Global Database on Child Growth and Malnutrition. Country-level data are unadjusted data from national surveys, and thus may not be comparable across countries.
Categorie:
Health
sono stati aggiornati
23 apr 2017 anni
Indicatori delle variazioni dei valori per anni
In media:
0.83
Minima:
0.2
1 gen 2012 anni
Massimo:
1.8
1 gen 1992 anni
Alla data di osservazione
Valore
Variazione assoluta
La variazione rispetto al valore precedente
1 gen 1992 anni
1.8
+1.8
0.0%
1 gen 1997 anni
1.5
-0.3
-16.67%
1 gen 2001 anni
1.1
-0.4
-26.67%
1 gen 2006 anni
0.9
-0.2
-18.18%
1 gen 2009 anni
0.8
-0.1
-11.11%
1 gen 2010 anni
0.5
-0.3
-37.5%
1 gen 2011 anni
0.5
0.0
0.0%
1 gen 2012 anni
0.2
-0.3
-60.0%
1 gen 2013 anni
0.5
+0.3
150.0%
1 gen 2015 anni
0.5
0.0
0.0%
Classificazione dei paesi secondo i statistiche attuali per anni