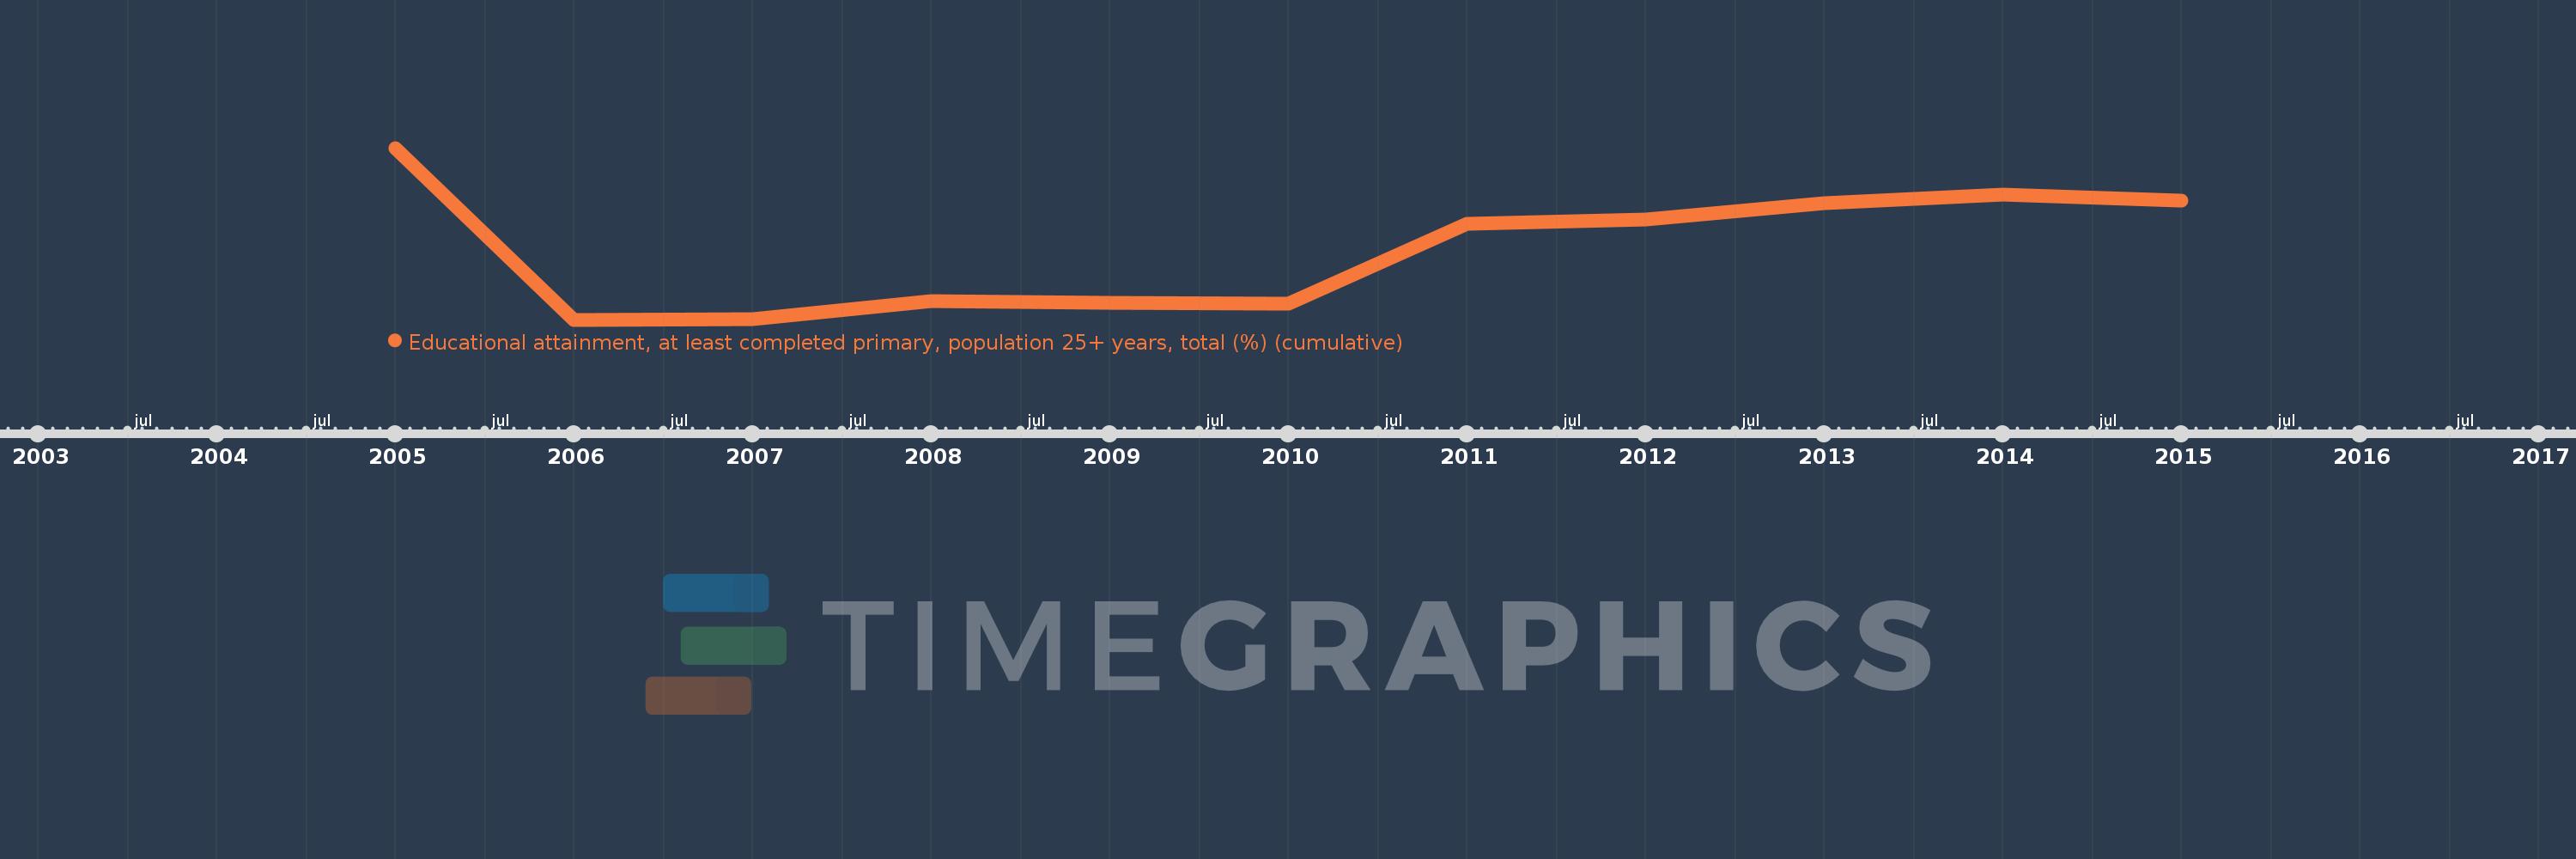
Questa scala temporale mostra un grafico dal 2005 anno al 2015 anno. Peru. I dati fino ad 2004 anno non disponibili. Il numero di osservazioni attuali secondo i date: 11.
La fonte (nome):
Indicatori dello sviluppo mondiale
La fonte (organizzazione):
United Nations Educational, Scientific, and Cultural Organization (UNESCO) Institute for Statistics.
Categorie:
Education, Gender
sono stati aggiornati
23 apr 2017 anni
Indicatori delle variazioni dei valori per anni
In media:
76.256
Minima:
71.086
1 gen 2006 anni
Massimo:
83.593
1 gen 2005 anni
Alla data di osservazione
Valore
Variazione assoluta
La variazione rispetto al valore precedente
1 gen 2005 anni
83.593
+83.593
0.0%
1 gen 2006 anni
71.086
-12.507
-14.96%
1 gen 2007 anni
71.145
+0.059
0.08%
1 gen 2008 anni
72.465
+1.32
1.86%
1 gen 2009 anni
72.313
-0.152
-0.21%
1 gen 2010 anni
72.249
-0.064
-0.09%
1 gen 2011 anni
78.07
+5.821
8.06%
1 gen 2012 anni
78.405
+0.335
0.43%
1 gen 2013 anni
79.545
+1.14
1.45%
1 gen 2014 anni
80.173
+0.628
0.79%
1 gen 2015 anni
79.778
-0.395
-0.49%
Classificazione dei paesi secondo i statistiche attuali per anni