33
/it/
AIzaSyAYiBZKx7MnpbEhh9jyipgxe19OcubqV5w
August 1, 2025
220781
Paraguay
PRY
true
2
1
External resources for health (% of total expenditure on health)
2015,2014,2013,2012,2011,2010,2009,2008,2007,2005,2004,2003,2002,2001,2000,1999,1998,1997,1996
Download
Biblioteca di statistiche globali →Paraguay →

External resources for health (% of total expenditure on health)

Queste statistiche in altri paesi:

AfghanistanAlbaniaAlgeriaAndorraAngolaAntigua and BarbudaArab WorldArgentinaArmeniaAustriaAzerbaijanBahamas, TheBahrainBangladeshBarbadosBelarusBelizeBeninBhutanBoliviaBosnia and HerzegovinaBotswanaBrazilBrunei DarussalamBulgariaBurkina FasoBurundiCabo VerdeCambodiaCameroonCaribbean small statesCentral African RepublicCentral Europe and the BalticsChadChileChinaColombiaComorosCongo, Dem. Rep.Congo, Rep.Costa RicaCote d'IvoireCroatiaCubaCyprusDenmarkDjiboutiDominicaDominican RepublicEarly-demographic dividendEast Asia & PacificEast Asia & Pacific (excluding high income)East Asia & Pacific (IDA & IBRD countries)EcuadorEgypt, Arab Rep.El SalvadorEquatorial GuineaEritreaEstoniaEthiopiaEuro areaEurope & Central AsiaEurope & Central Asia (excluding high income)Europe & Central Asia (IDA & IBRD countries)European UnionFijiFinlandFragile and conflict affected situationsFranceGabonGambia, TheGeorgiaGermanyGhanaGrenadaGuatemalaGuineaGuinea-BissauGuyanaHaitiHeavily indebted poor countries (HIPC)HondurasIBRD onlyIcelandIDA & IBRD totalIDA blendIDA onlyIDA totalIndiaIndonesiaIran, Islamic Rep.IraqJamaicaJordanKazakhstanKenyaKiribatiKorea, Rep.KuwaitKyrgyz RepublicLao PDRLate-demographic dividendLatin America & Caribbean Latin America & Caribbean (excluding high income)Latin America & the Caribbean (IDA & IBRD countries)LatviaLeast developed countries: UN classificationLebanonLesothoLiberiaLibyaLithuaniaLow & middle incomeLow incomeLower middle incomeLuxembourgMacedonia, FYRMadagascarMalawiMalaysiaMaldivesMaliMaltaMarshall IslandsMauritaniaMauritiusMexicoMicronesia, Fed. Sts.Middle East & North AfricaMiddle East & North Africa (excluding high income)Middle East & North Africa (IDA & IBRD countries)Middle incomeMoldovaMonacoMongoliaMontenegroMoroccoMozambiqueMyanmarNamibiaNauruNepalNetherlandsNicaraguaNigerNigeriaOmanOther small statesPacific island small statesPakistanPalauPanamaPapua New GuineaParaguayPeruPhilippinesPolandPortugalPre-demographic dividendQatarRomaniaRussian FederationRwandaSamoaSan MarinoSao Tome and PrincipeSaudi ArabiaSenegalSerbiaSeychellesSierra LeoneSingaporeSlovak RepublicSmall statesSolomon IslandsSouth AfricaSouth AsiaSouth Asia (IDA & IBRD)South SudanSpainSri LankaSt. Kitts and NevisSt. LuciaSt. Vincent and the GrenadinesSub-Saharan Africa Sub-Saharan Africa (excluding high income)Sub-Saharan Africa (IDA & IBRD countries)SudanSurinameSwazilandSwedenSwitzerlandSyrian Arab RepublicTajikistanTanzaniaThailandTimor-LesteTogoTongaTrinidad and TobagoTunisiaTurkeyTurkmenistanTuvaluUgandaUkraineUnited Arab EmiratesUnited KingdomUpper middle incomeUruguayUzbekistanVanuatuVenezuela, RBVietnamWorldYemen, Rep.ZambiaZimbabwe

Linea del tempo:

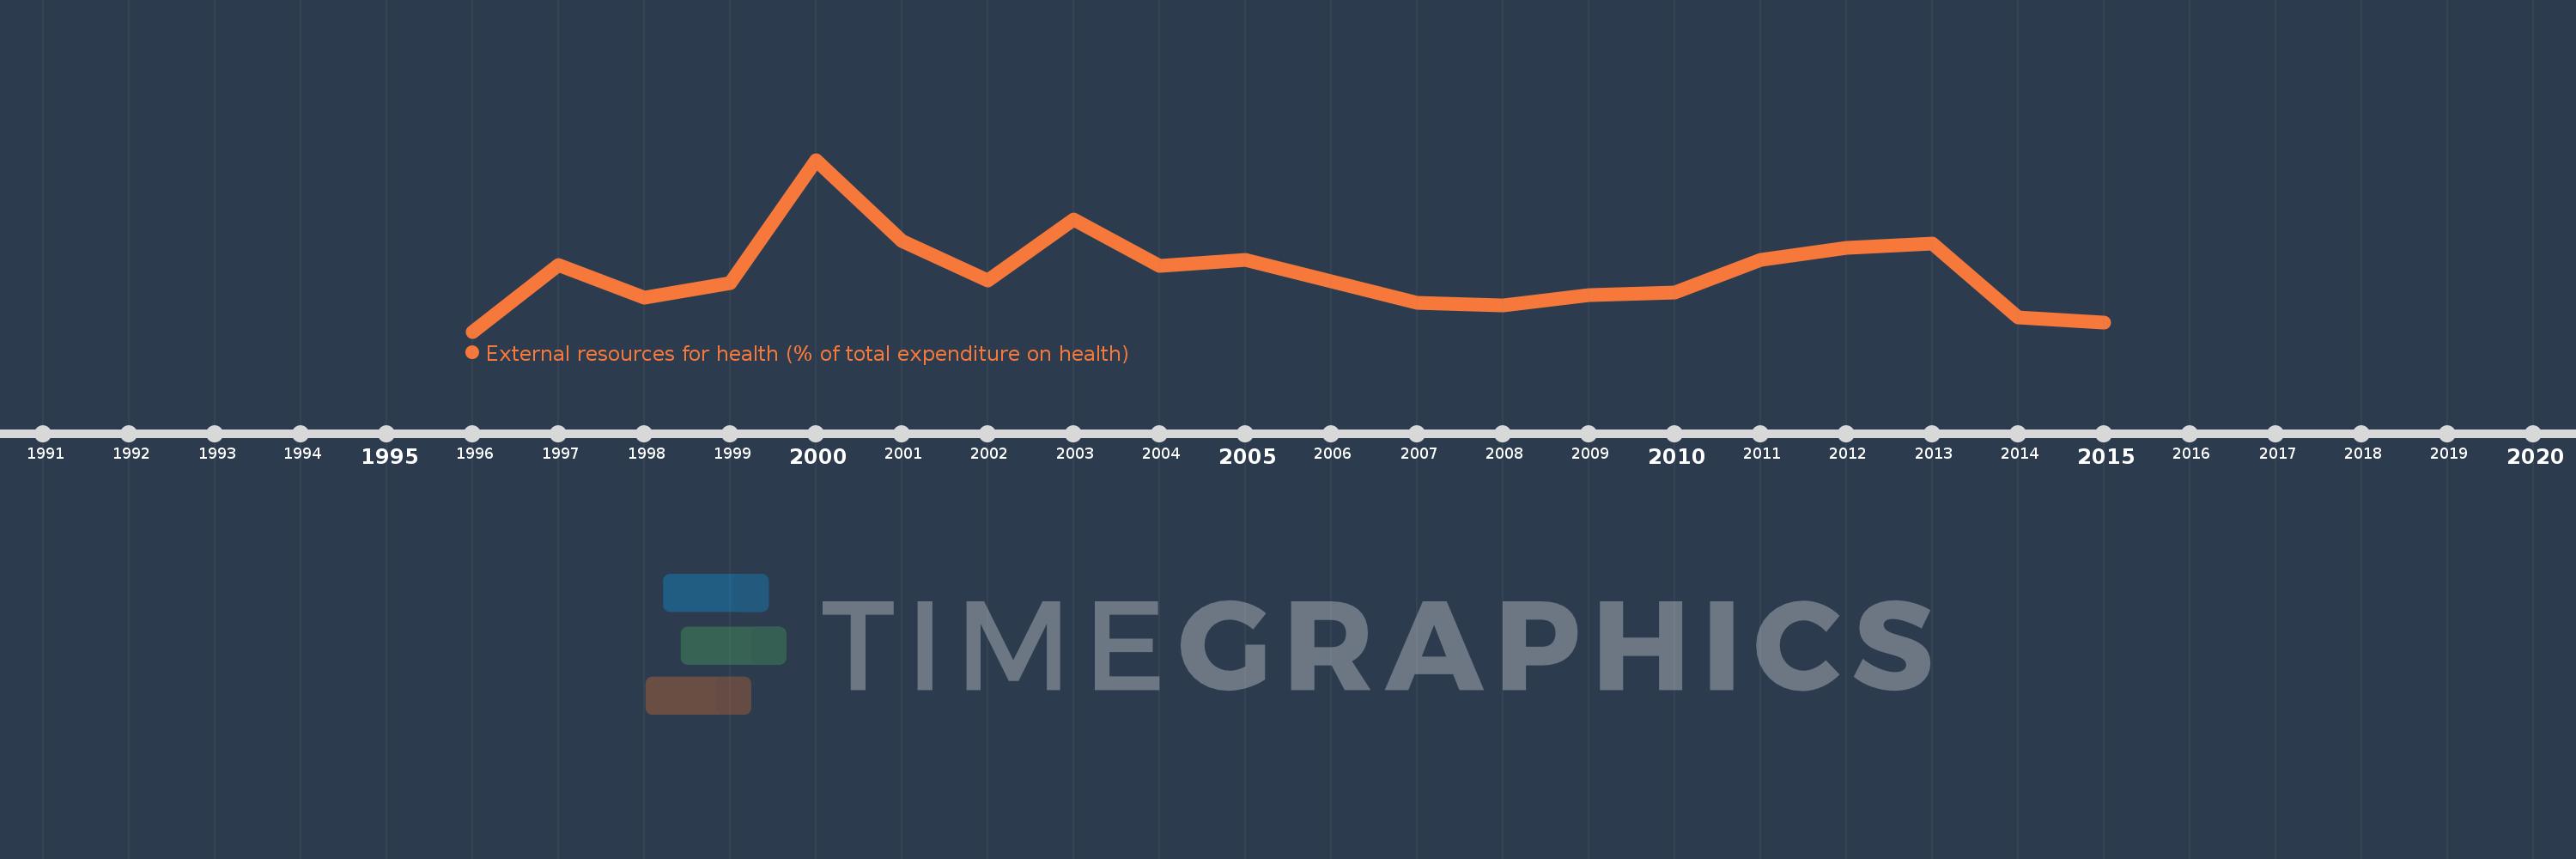
Questa scala temporale mostra un grafico dal 1996 anno al 2015 anno. Paraguay. I dati fino ad 1995 anno non disponibili. Il numero di osservazioni attuali secondo i date: 19.

La fonte (nome):

Indicatori dello sviluppo mondiale

La fonte (organizzazione):

World Health Organization Global Health Expenditure database (see http://apps.who.int/nha/database for the most recent updates).

Categorie:

Health

sono stati aggiornati

23 apr 2017 anni

Indicatori delle variazioni dei valori per anni

In media:
1.829
Minima:
0.116
1 gen 1996 anni
Massimo:
5.154
1 gen 2000 anni
Alla data di osservazione
Valore
Variazione assoluta
La variazione rispetto al valore precedente
1 gen 1996 anni
0.116
+0.116
0.0%
1 gen 1997 anni
2.064
+1.948
1.68 Mille.%
1 gen 1998 anni
1.108
-0.956
-46.33%
1 gen 1999 anni
1.541
+0.434
39.14%
1 gen 2000 anni
5.154
+3.613
234.4%
1 gen 2001 anni
2.781
-2.373
-46.04%
1 gen 2002 anni
1.614
-1.167
-41.97%
1 gen 2003 anni
3.405
+1.791
110.96%
1 gen 2004 anni
2.038
-1.367
-40.14%
1 gen 2005 anni
2.221
+0.183
8.98%
1 gen 2007 anni
0.958
-1.263
-56.87%
1 gen 2008 anni
0.889
-0.069
-7.23%
1 gen 2009 anni
1.195
+0.306
34.47%
1 gen 2010 anni
1.268
+0.073
6.15%
1 gen 2011 anni
2.224
+0.956
75.36%
1 gen 2012 anni
2.561
+0.337
15.15%
1 gen 2013 anni
2.709
+0.148
5.78%
1 gen 2014 anni
0.529
-2.18
-80.48%
1 gen 2015 anni
0.384
-0.145
-27.39%

Classificazione dei paesi secondo i statistiche attuali per anni