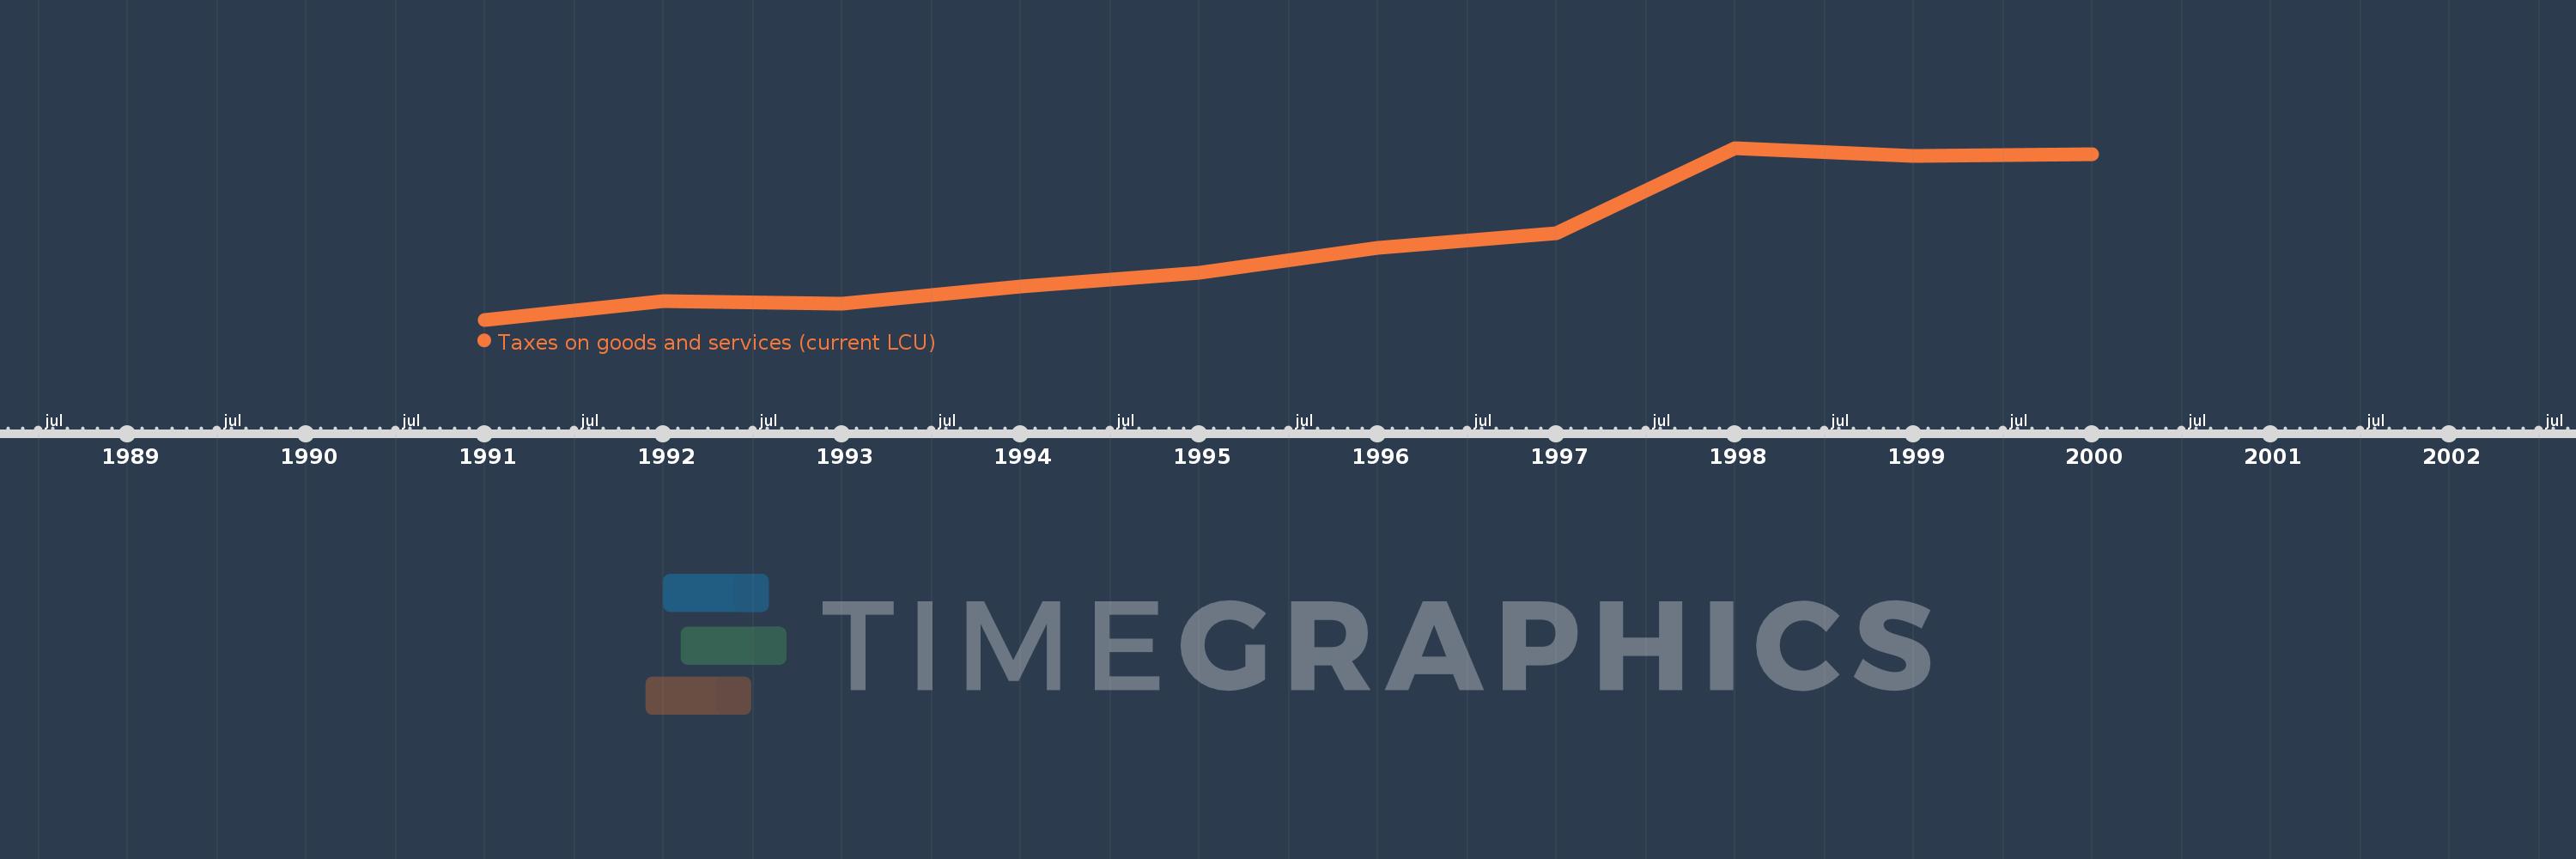
Questa scala temporale mostra un grafico dal 1991 anno al 2000 anno. Oman. I dati fino ad 1990 anno non disponibili. Il numero di osservazioni attuali secondo i date: 10.
La fonte (nome):
Indicatori dello sviluppo mondiale
La fonte (organizzazione):
International Monetary Fund, Government Finance Statistics Yearbook and data files.
Categorie:
Public Sector
sono stati aggiornati
23 apr 2017 anni
Indicatori delle variazioni dei valori per anni
In media:
16.81 Mln
Minima:
11.0 Mln
1 gen 1991 anni
Massimo:
23.9 Mln
1 gen 1998 anni
Alla data di osservazione
Valore
Variazione assoluta
La variazione rispetto al valore precedente
1 gen 1991 anni
11.0 Mln
+11.0 Mln
0.0%
1 gen 1992 anni
12.4 Mln
+1.4 Mln
12.73%
1 gen 1993 anni
12.2 Mln
-200.0 Mille.
-1.61%
1 gen 1994 anni
13.5 Mln
+1.3 Mln
10.66%
1 gen 1995 anni
14.5 Mln
+1000.0 Mille.
7.41%
1 gen 1996 anni
16.4 Mln
+1.9 Mln
13.1%
1 gen 1997 anni
17.5 Mln
+1.1 Mln
6.71%
1 gen 1998 anni
23.9 Mln
+6.4 Mln
36.57%
1 gen 1999 anni
23.3 Mln
-600.0 Mille.
-2.51%
1 gen 2000 anni
23.4 Mln
+100.0 Mille.
0.43%
Classificazione dei paesi secondo i statistiche attuali per anni