33
/it/
AIzaSyB4mHJ5NPEv-XzF7P6NDYXjlkCWaeKw5bc
November 30, 2025
215833
Oman
OMN
true
2
1
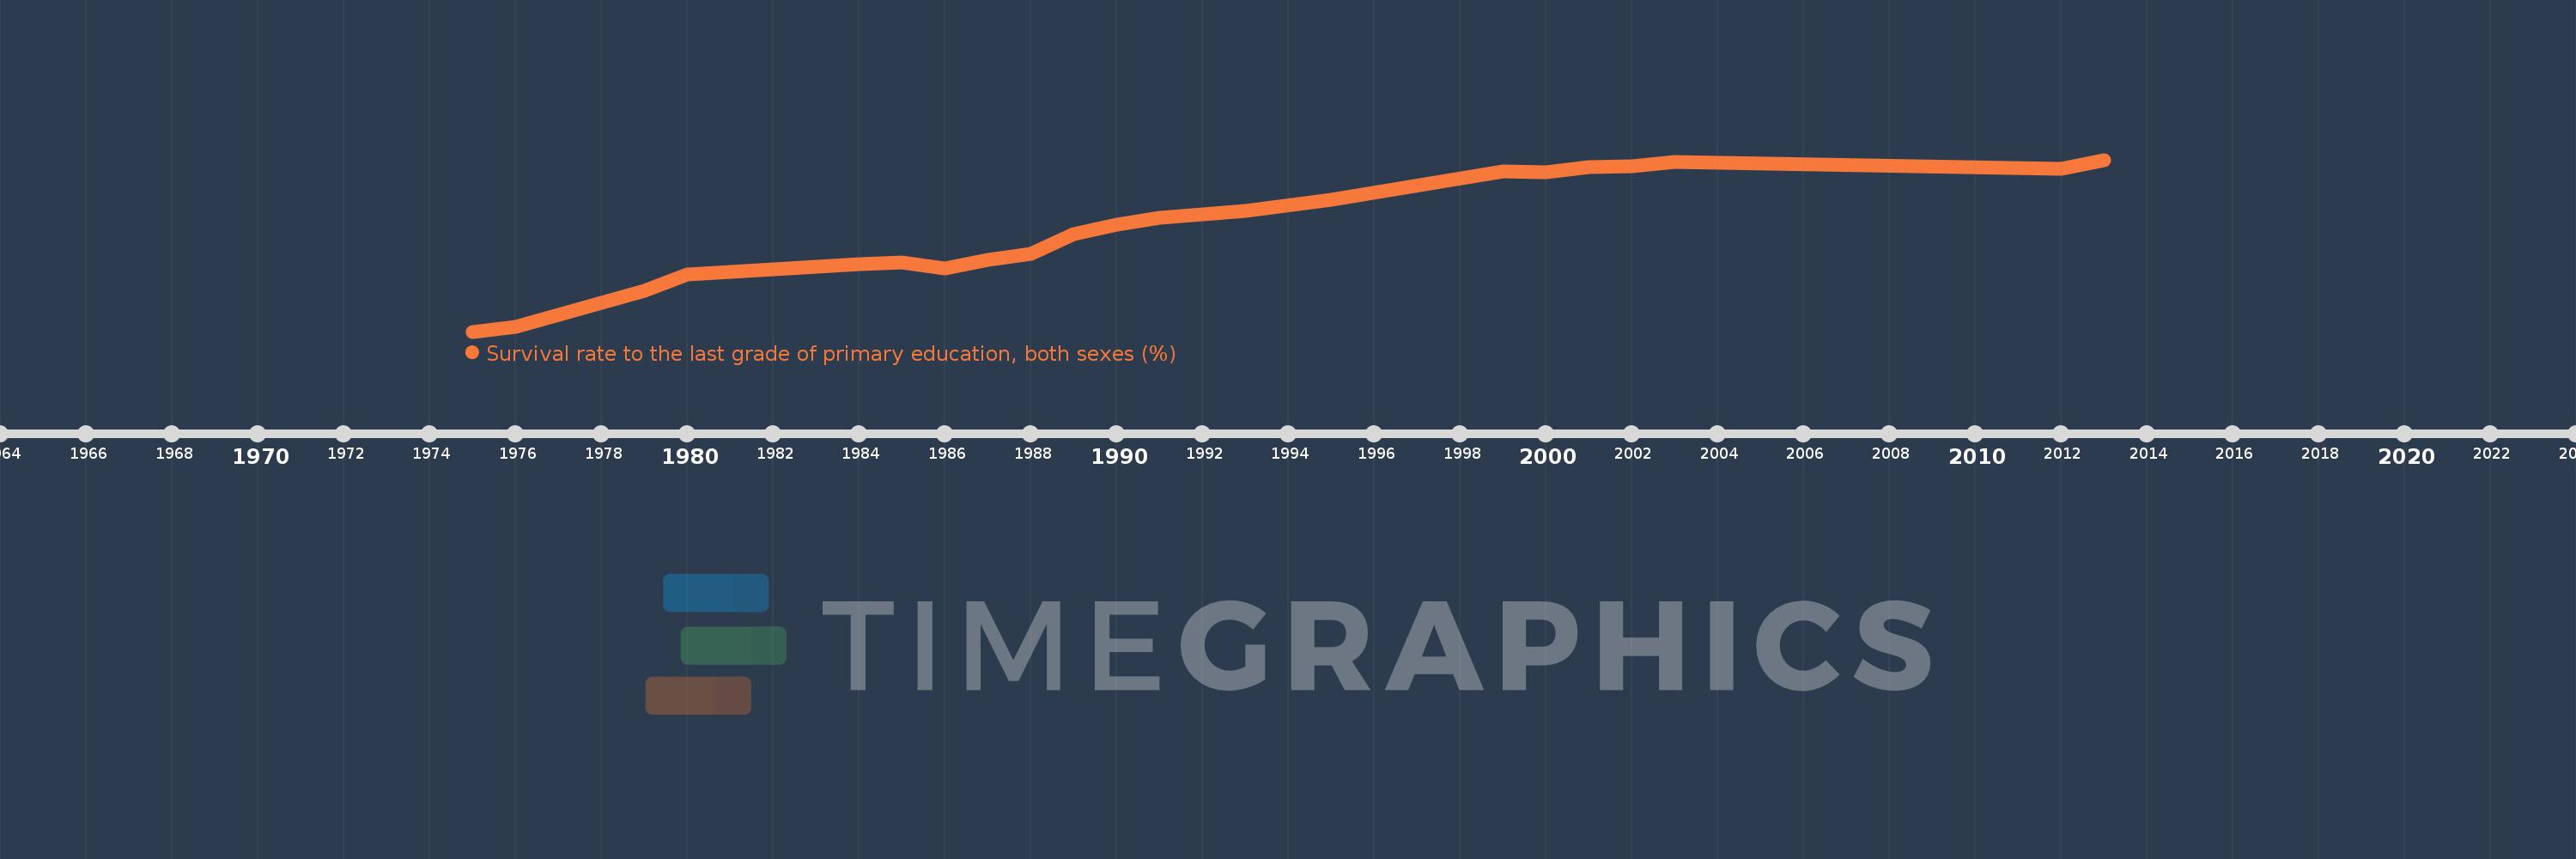
Survival rate to the last grade of primary education, both sexes (%)
2013,2012,2003,2002,2001,2000,1999,1995,1993,1991,1990,1989,1988,1987,1986,1985,1984,1980,1979,1976,1975