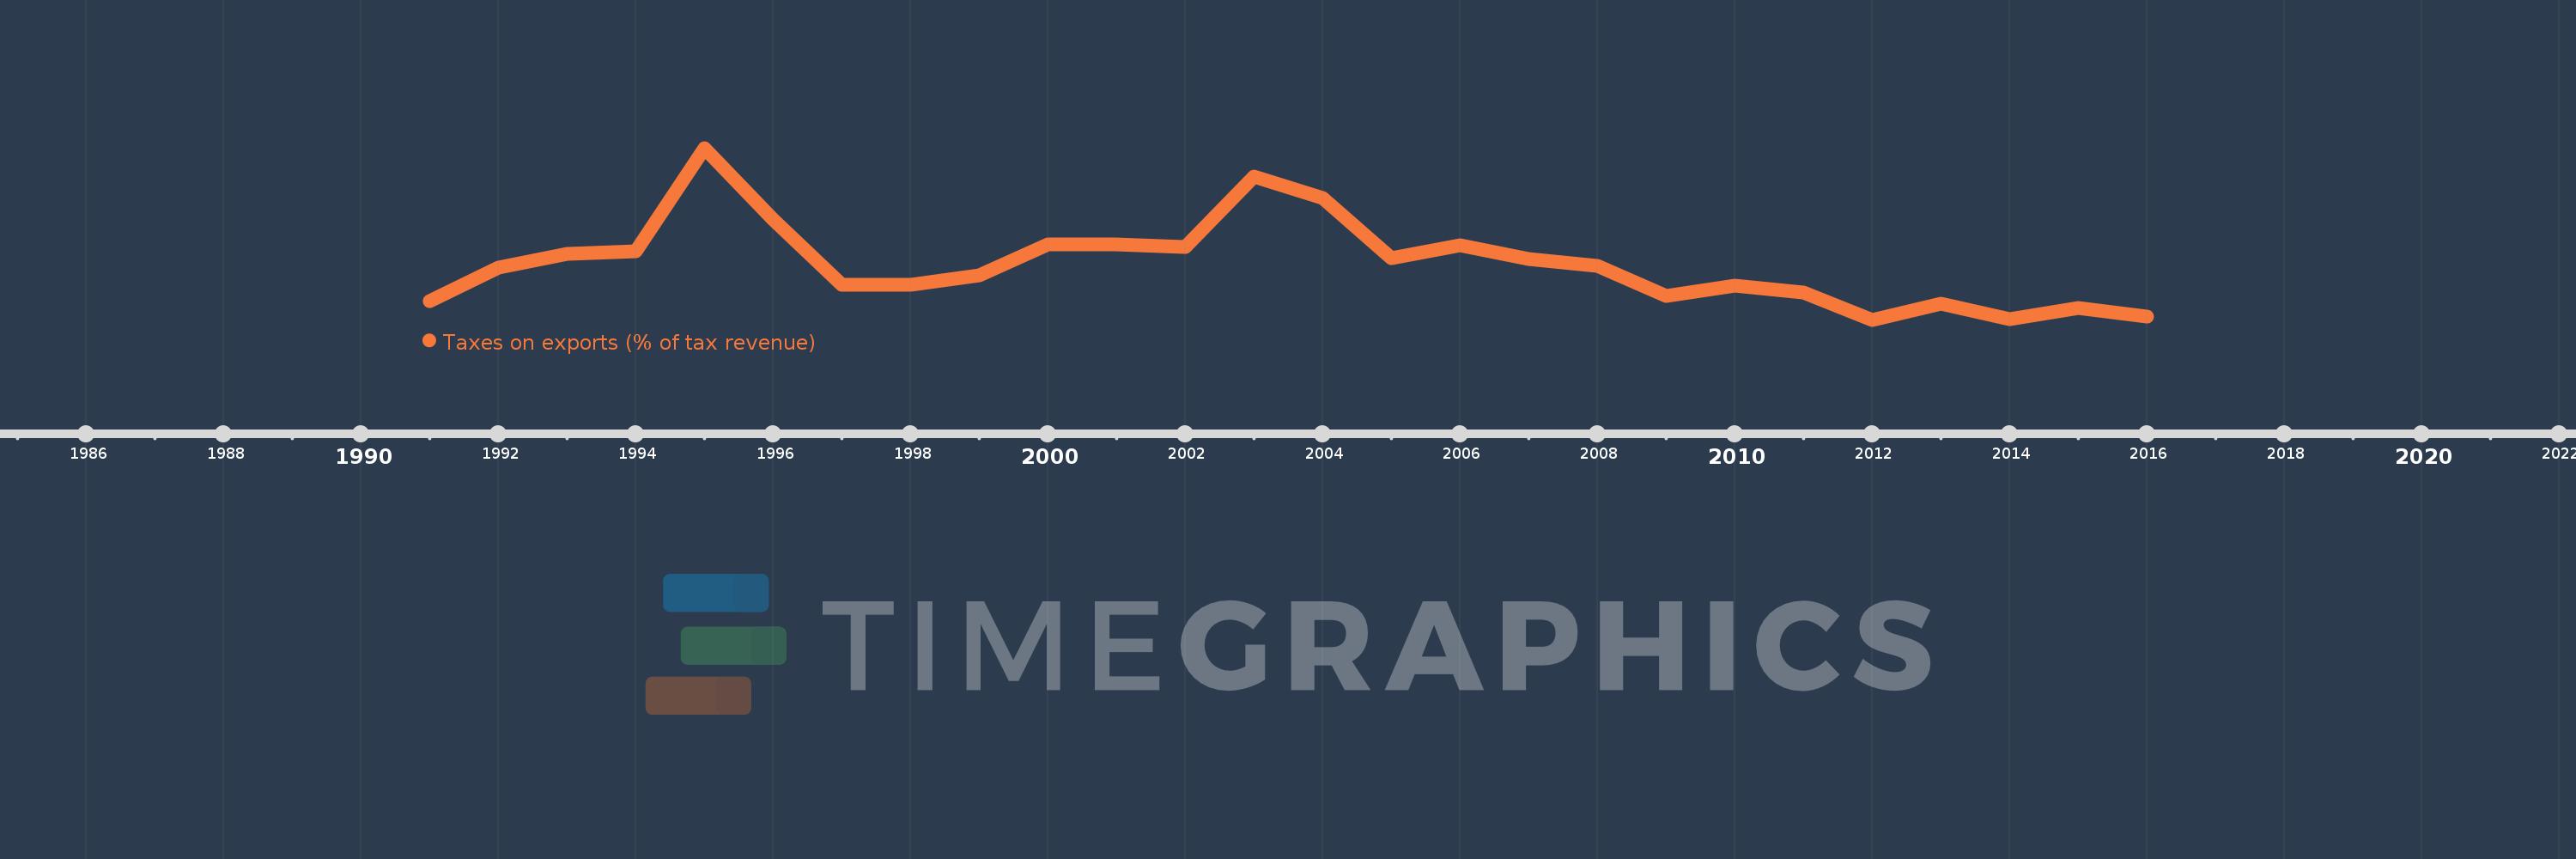
Questa scala temporale mostra un grafico dal 1991 anno al 2016 anno. Nepal. I dati fino ad 1990 anno non disponibili. Il numero di osservazioni attuali secondo i date: 26.
La fonte (nome):
Indicatori dello sviluppo mondiale
La fonte (organizzazione):
International Monetary Fund, Government Finance Statistics Yearbook and data files.
Categorie:
Public Sector, Trade
sono stati aggiornati
23 apr 2017 anni
Indicatori delle variazioni dei valori per anni
In media:
1.007
Minima:
0.161
1 gen 2012 anni
Massimo:
2.772
1 gen 1995 anni
Alla data di osservazione
Valore
Variazione assoluta
La variazione rispetto al valore precedente
1 gen 1991 anni
0.445
+0.445
0.0%
1 gen 1992 anni
0.952
+0.507
113.85%
1 gen 1993 anni
1.161
+0.21
22.05%
1 gen 1994 anni
1.206
+0.045
3.84%
1 gen 1995 anni
2.772
+1.566
129.87%
1 gen 1996 anni
1.686
-1.087
-39.19%
1 gen 1997 anni
0.691
-0.995
-59.01%
1 gen 1998 anni
0.687
-0.005
-0.66%
1 gen 1999 anni
0.835
+0.148
21.61%
1 gen 2000 anni
1.312
+0.477
57.16%
1 gen 2001 anni
1.303
-0.009
-0.69%
1 gen 2002 anni
1.268
-0.035
-2.65%
1 gen 2003 anni
2.331
+1.063
83.8%
1 gen 2004 anni
2.009
-0.322
-13.83%
1 gen 2005 anni
1.094
-0.915
-45.54%
1 gen 2006 anni
1.29
+0.196
17.89%
1 gen 2007 anni
1.089
-0.201
-15.59%
1 gen 2008 anni
0.982
-0.107
-9.79%
1 gen 2009 anni
0.523
-0.459
-46.72%
1 gen 2010 anni
0.678
+0.155
29.6%
1 gen 2011 anni
0.573
-0.105
-15.52%
1 gen 2012 anni
0.161
-0.412
-71.84%
1 gen 2013 anni
0.407
+0.246
152.26%
1 gen 2014 anni
0.169
-0.238
-58.37%
1 gen 2015 anni
0.342
+0.173
102.15%
1 gen 2016 anni
0.205
-0.138
-40.17%
Classificazione dei paesi secondo i statistiche attuali per anni