33
/it/
AIzaSyB4mHJ5NPEv-XzF7P6NDYXjlkCWaeKw5bc
November 30, 2025
205254
Namibia
NAM
true
2
1
Fossil fuel energy consumption (% of total)
2014,2013,2012,2011,2010,2009,2008,2007,2006,2005,2004,2003,2002,2001,2000,1999,1998,1997,1996,1995,1994,1993,1992
Create a timeline
Public Timelines
For education
For educational institutions
For teachers
For students
Cabinet
For educational institutions
For teachers
For students
Open cabinet
FAQ
Close
Create a timeline
Public timelines
FAQ
About & Feedback
Accordo
Privatezza
FAQ
Support 24/7
Cabinet
Get premium
Donate
Download
Biblioteca di statistiche globali
→
Namibia
→
Fossil fuel energy consumption (% of total)
Queste statistiche in altri paesi:
Albania
Algeria
Angola
Antigua and Barbuda
Arab World
Argentina
Armenia
Australia
Austria
Azerbaijan
Bahamas, The
Bahrain
Bangladesh
Barbados
Belarus
Belgium
Belize
Benin
Bhutan
Bolivia
Bosnia and Herzegovina
Botswana
Brazil
Brunei Darussalam
Bulgaria
Cabo Verde
Cambodia
Cameroon
Canada
Caribbean small states
Central Europe and the Baltics
Chile
China
Colombia
Comoros
Congo, Dem. Rep.
Congo, Rep.
Costa Rica
Cote d'Ivoire
Croatia
Cuba
Curacao
Cyprus
Czech Republic
Denmark
Djibouti
Dominica
Dominican Republic
Early-demographic dividend
East Asia & Pacific
East Asia & Pacific (excluding high income)
East Asia & Pacific (IDA & IBRD countries)
Ecuador
Egypt, Arab Rep.
El Salvador
Equatorial Guinea
Eritrea
Estonia
Ethiopia
Euro area
Europe & Central Asia
Europe & Central Asia (excluding high income)
Europe & Central Asia (IDA & IBRD countries)
European Union
Fiji
Finland
Fragile and conflict affected situations
France
Gabon
Gambia, The
Georgia
Germany
Ghana
Gibraltar
Greece
Grenada
Guatemala
Guinea-Bissau
Guyana
Haiti
Heavily indebted poor countries (HIPC)
High income
Honduras
Hong Kong SAR, China
Hungary
IBRD only
Iceland
IDA & IBRD total
IDA blend
IDA only
IDA total
India
Indonesia
Iran, Islamic Rep.
Iraq
Ireland
Israel
Italy
Jamaica
Japan
Jordan
Kazakhstan
Kenya
Kiribati
Korea, Dem. People’s Rep.
Korea, Rep.
Kosovo
Kuwait
Kyrgyz Republic
Late-demographic dividend
Latin America & Caribbean
Latin America & Caribbean (excluding high income)
Latin America & the Caribbean (IDA & IBRD countries)
Latvia
Least developed countries: UN classification
Lebanon
Lesotho
Libya
Lithuania
Low & middle income
Low income
Lower middle income
Luxembourg
Macedonia, FYR
Malaysia
Maldives
Malta
Marshall Islands
Mauritius
Mexico
Middle East & North Africa
Middle East & North Africa (excluding high income)
Middle East & North Africa (IDA & IBRD countries)
Middle income
Moldova
Mongolia
Montenegro
Morocco
Mozambique
Myanmar
Namibia
Nepal
Netherlands
New Zealand
Nicaragua
Niger
Nigeria
North America
Norway
OECD members
Oman
Other small states
Pacific island small states
Pakistan
Palau
Panama
Paraguay
Peru
Philippines
Poland
Portugal
Post-demographic dividend
Pre-demographic dividend
Qatar
Romania
Russian Federation
Samoa
Sao Tome and Principe
Saudi Arabia
Senegal
Serbia
Seychelles
Singapore
Slovak Republic
Slovenia
Small states
Solomon Islands
South Africa
South Asia
South Asia (IDA & IBRD)
South Sudan
Spain
Sri Lanka
St. Kitts and Nevis
St. Lucia
St. Vincent and the Grenadines
Sub-Saharan Africa
Sub-Saharan Africa (excluding high income)
Sub-Saharan Africa (IDA & IBRD countries)
Sudan
Suriname
Swaziland
Sweden
Switzerland
Syrian Arab Republic
Tajikistan
Tanzania
Thailand
Timor-Leste
Togo
Tonga
Trinidad and Tobago
Tunisia
Turkey
Ukraine
United Arab Emirates
United Kingdom
United States
Upper middle income
Uruguay
Uzbekistan
Vanuatu
Venezuela, RB
Vietnam
World
Yemen, Rep.
Zambia
Zimbabwe
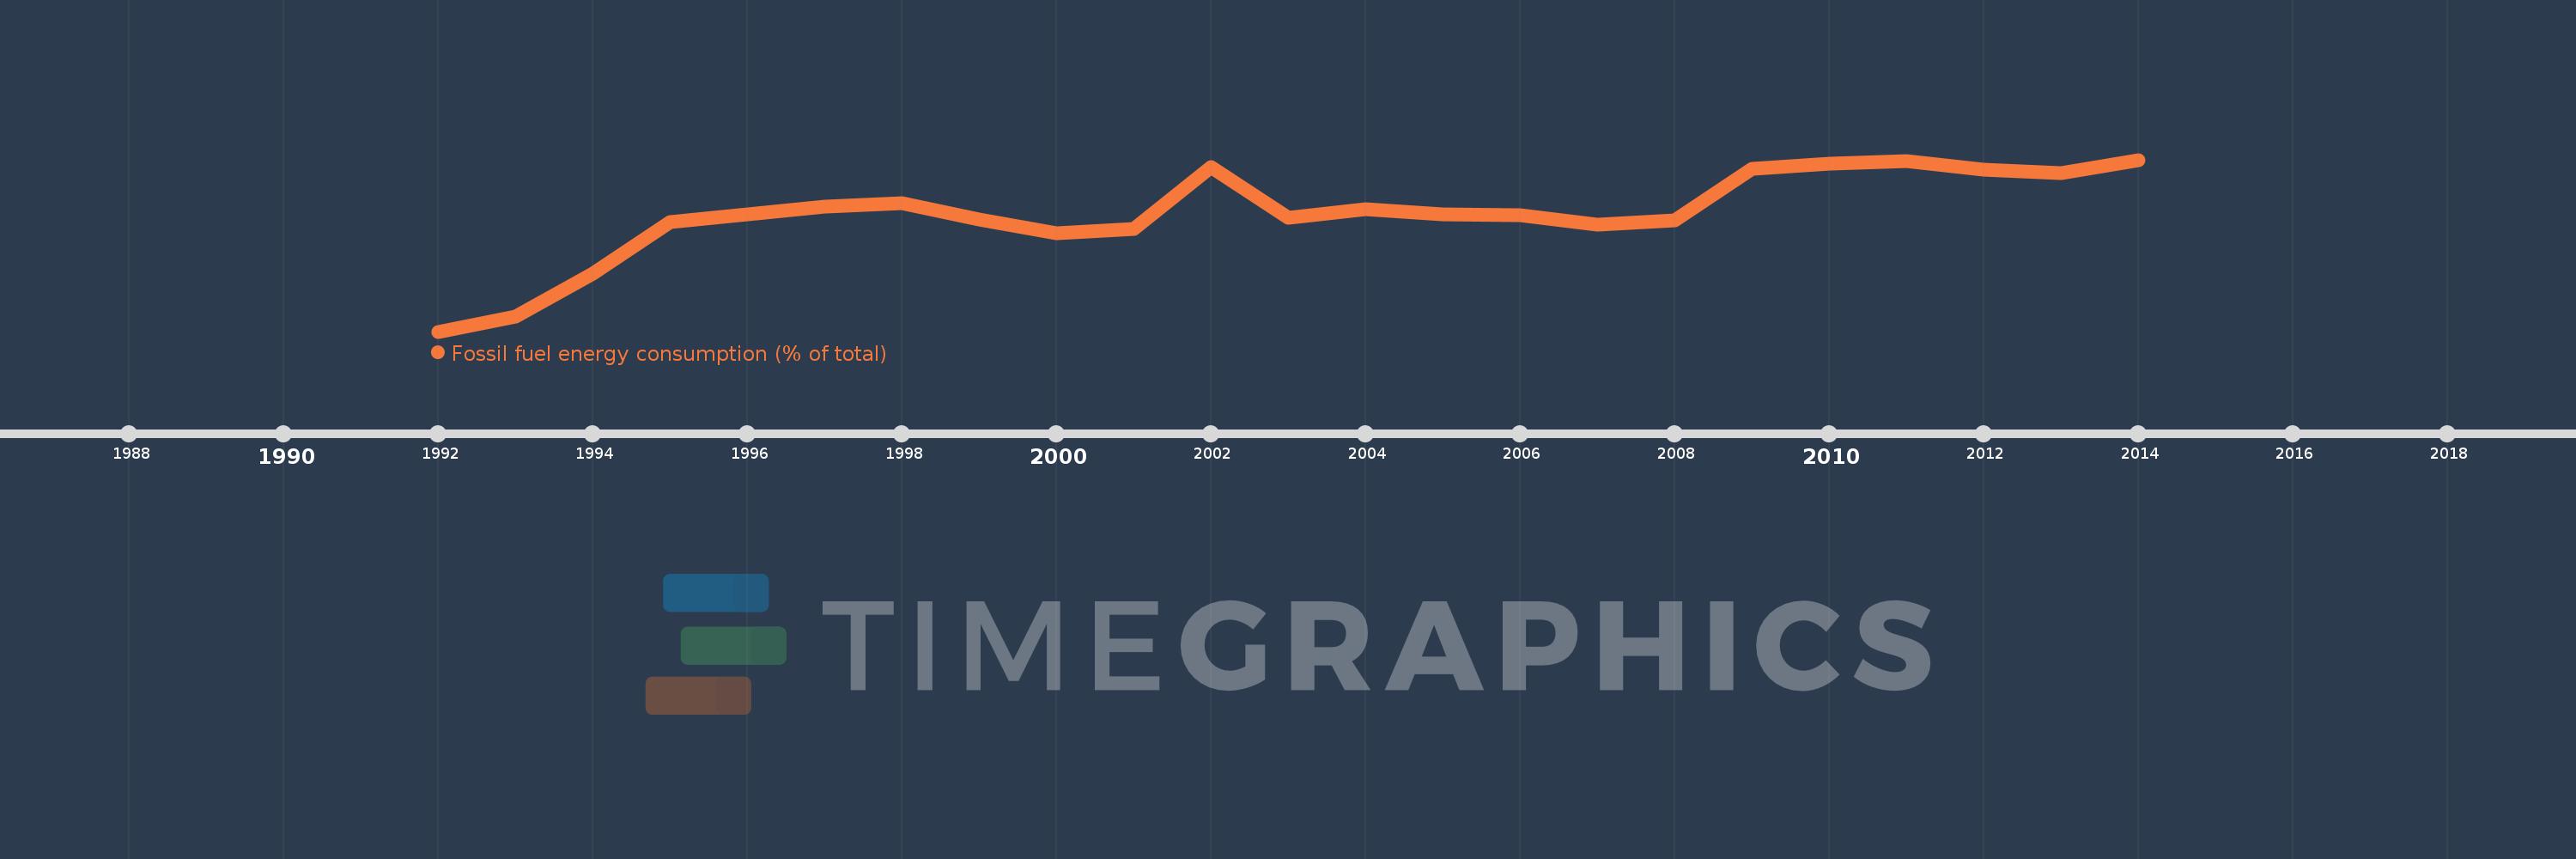
Linea del tempo:
Questa scala temporale mostra un grafico dal
1992
anno al
2014
anno. Namibia. I dati fino ad
1991
anno non disponibili. Il numero di osservazioni attuali secondo i date:
23
.
La fonte (nome):
Indicatori dello sviluppo mondiale
La fonte (organizzazione):
IEA Statistics © OECD/IEA 2014 (http://www.iea.org/stats/index.asp), subject to https://www.iea.org/t&c/termsandconditions/
Categorie:
Energy & Mining
sono stati aggiornati
23 apr 2017 anni
Indicatori delle variazioni dei valori per anni
In media:
62.398
Minima:
53.401
1 gen 1992 anni
Massimo:
66.513
1 gen 2014 anni
Alla data di osservazione
Valore
Variazione assoluta
La variazione rispetto al valore precedente
1 gen 1992 anni
53.401
+53.401
0.0%
1 gen 1993 anni
54.521
+1.12
2.1%
1 gen 1994 anni
57.831
+3.31
6.07%
1 gen 1995 anni
61.737
+3.907
6.76%
1 gen 1996 anni
62.324
+0.587
0.95%
1 gen 1997 anni
62.953
+0.629
1.01%
1 gen 1998 anni
63.201
+0.248
0.39%
1 gen 1999 anni
61.976
-1.225
-1.94%
1 gen 2000 anni
60.893
-1.083
-1.75%
1 gen 2001 anni
61.222
+0.329
0.54%
1 gen 2002 anni
65.945
+4.723
7.71%
1 gen 2003 anni
62.073
-3.872
-5.87%
1 gen 2004 anni
62.712
+0.639
1.03%
1 gen 2005 anni
62.363
-0.348
-0.56%
1 gen 2006 anni
62.306
-0.058
-0.09%
1 gen 2007 anni
61.587
-0.719
-1.15%
1 gen 2008 anni
61.86
+0.274
0.44%
1 gen 2009 anni
65.834
+3.974
6.42%
1 gen 2010 anni
66.218
+0.384
0.58%
1 gen 2011 anni
66.41
+0.192
0.29%
1 gen 2012 anni
65.781
-0.629
-0.95%
1 gen 2013 anni
65.502
-0.279
-0.42%
1 gen 2014 anni
66.513
+1.011
1.54%
Classificazione dei paesi secondo i statistiche attuali per anni
About & Feedback
Accordo
Privatezza
FAQ
Support 24/7
Cabinet
Get premium
Donate
The service accepts bank transfer (ACH, Wire) or cards (Visa, MasterCard, etc). Processed by Stripe.
Secured with SSL