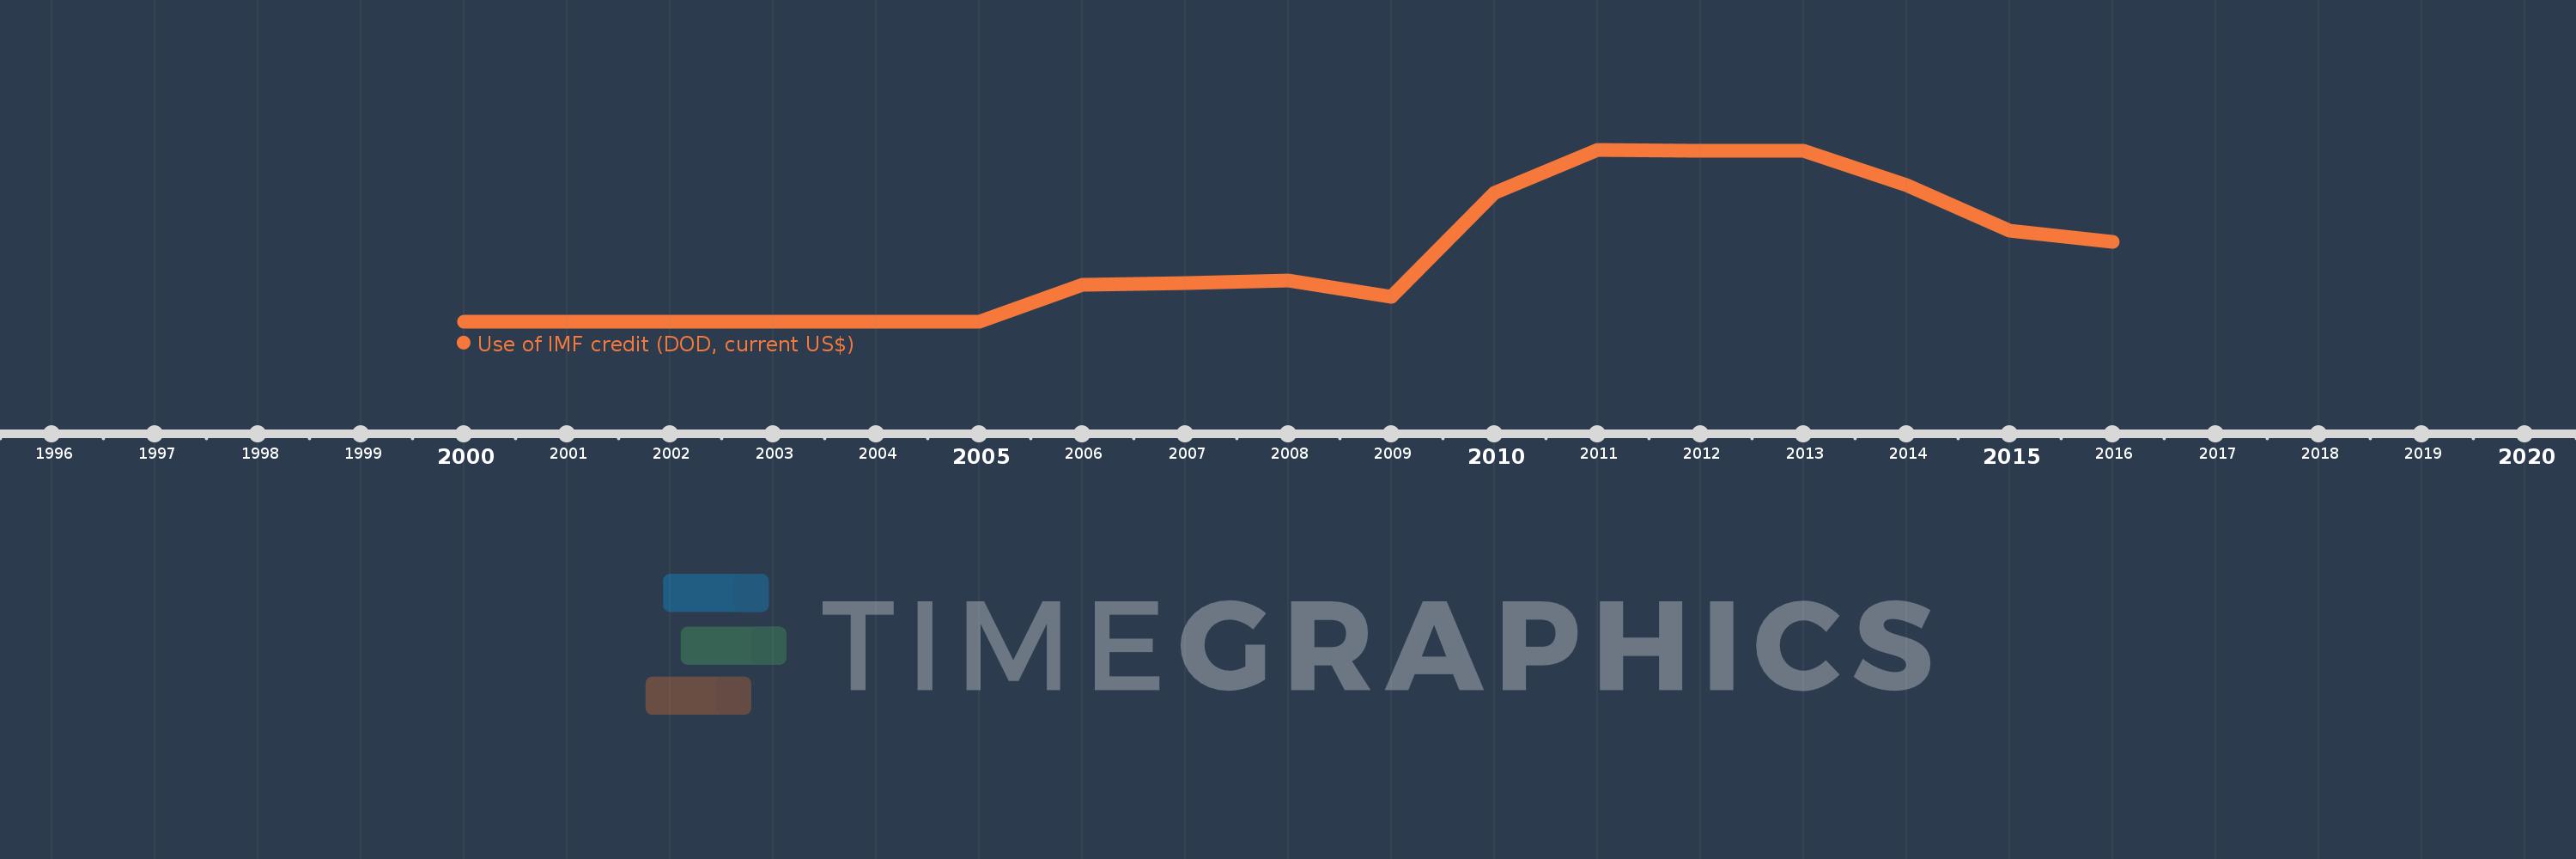
Questa scala temporale mostra un grafico dal 2000 anno al 2016 anno. Maldives. I dati fino ad 1999 anno non disponibili. Il numero di osservazioni attuali secondo i date: 17.
La fonte (nome):
Indicatori dello sviluppo mondiale
La fonte (organizzazione):
World Bank, International Debt Statistics.
Categorie:
External Debt
sono stati aggiornati
23 apr 2017 anni
Indicatori delle variazioni dei valori per anni
In media:
10.6 Mln
Minima:
355.0 Mille.
1 gen 2002 anni
Massimo:
27.63 Mln
1 gen 2011 anni
Alla data di osservazione
Valore
Variazione assoluta
La variazione rispetto al valore precedente
1 gen 2000 anni
388.0 Mille.
+388.0 Mille.
0.0%
1 gen 2001 anni
368.0 Mille.
-20.0 Mille.
-5.15%
1 gen 2002 anni
355.0 Mille.
-13.0 Mille.
-3.53%
1 gen 2003 anni
384.0 Mille.
+29.0 Mille.
8.17%
1 gen 2004 anni
420.0 Mille.
+36.0 Mille.
9.38%
1 gen 2005 anni
439.0 Mille.
+19.0 Mille.
4.52%
1 gen 2006 anni
6.264 Mln
+5.825 Mln
1.33 Mille.%
1 gen 2007 anni
6.593 Mln
+329.0 Mille.
5.25%
1 gen 2008 anni
6.925 Mln
+332.0 Mille.
5.04%
1 gen 2009 anni
4.383 Mln
-2.542 Mln
-36.71%
1 gen 2010 anni
20.896 Mln
+16.513 Mln
376.75%
1 gen 2011 anni
27.63 Mln
+6.734 Mln
32.23%
1 gen 2012 anni
27.544 Mln
-86.0 Mille.
-0.31%
1 gen 2013 anni
27.575 Mln
+31.0 Mille.
0.11%
1 gen 2014 anni
22.105 Mln
-5.47 Mln
-19.84%
1 gen 2015 anni
14.856 Mln
-7.249 Mln
-32.79%
1 gen 2016 anni
13.073 Mln
-1.783 Mln
-12.0%
Classificazione dei paesi secondo i statistiche attuali per anni