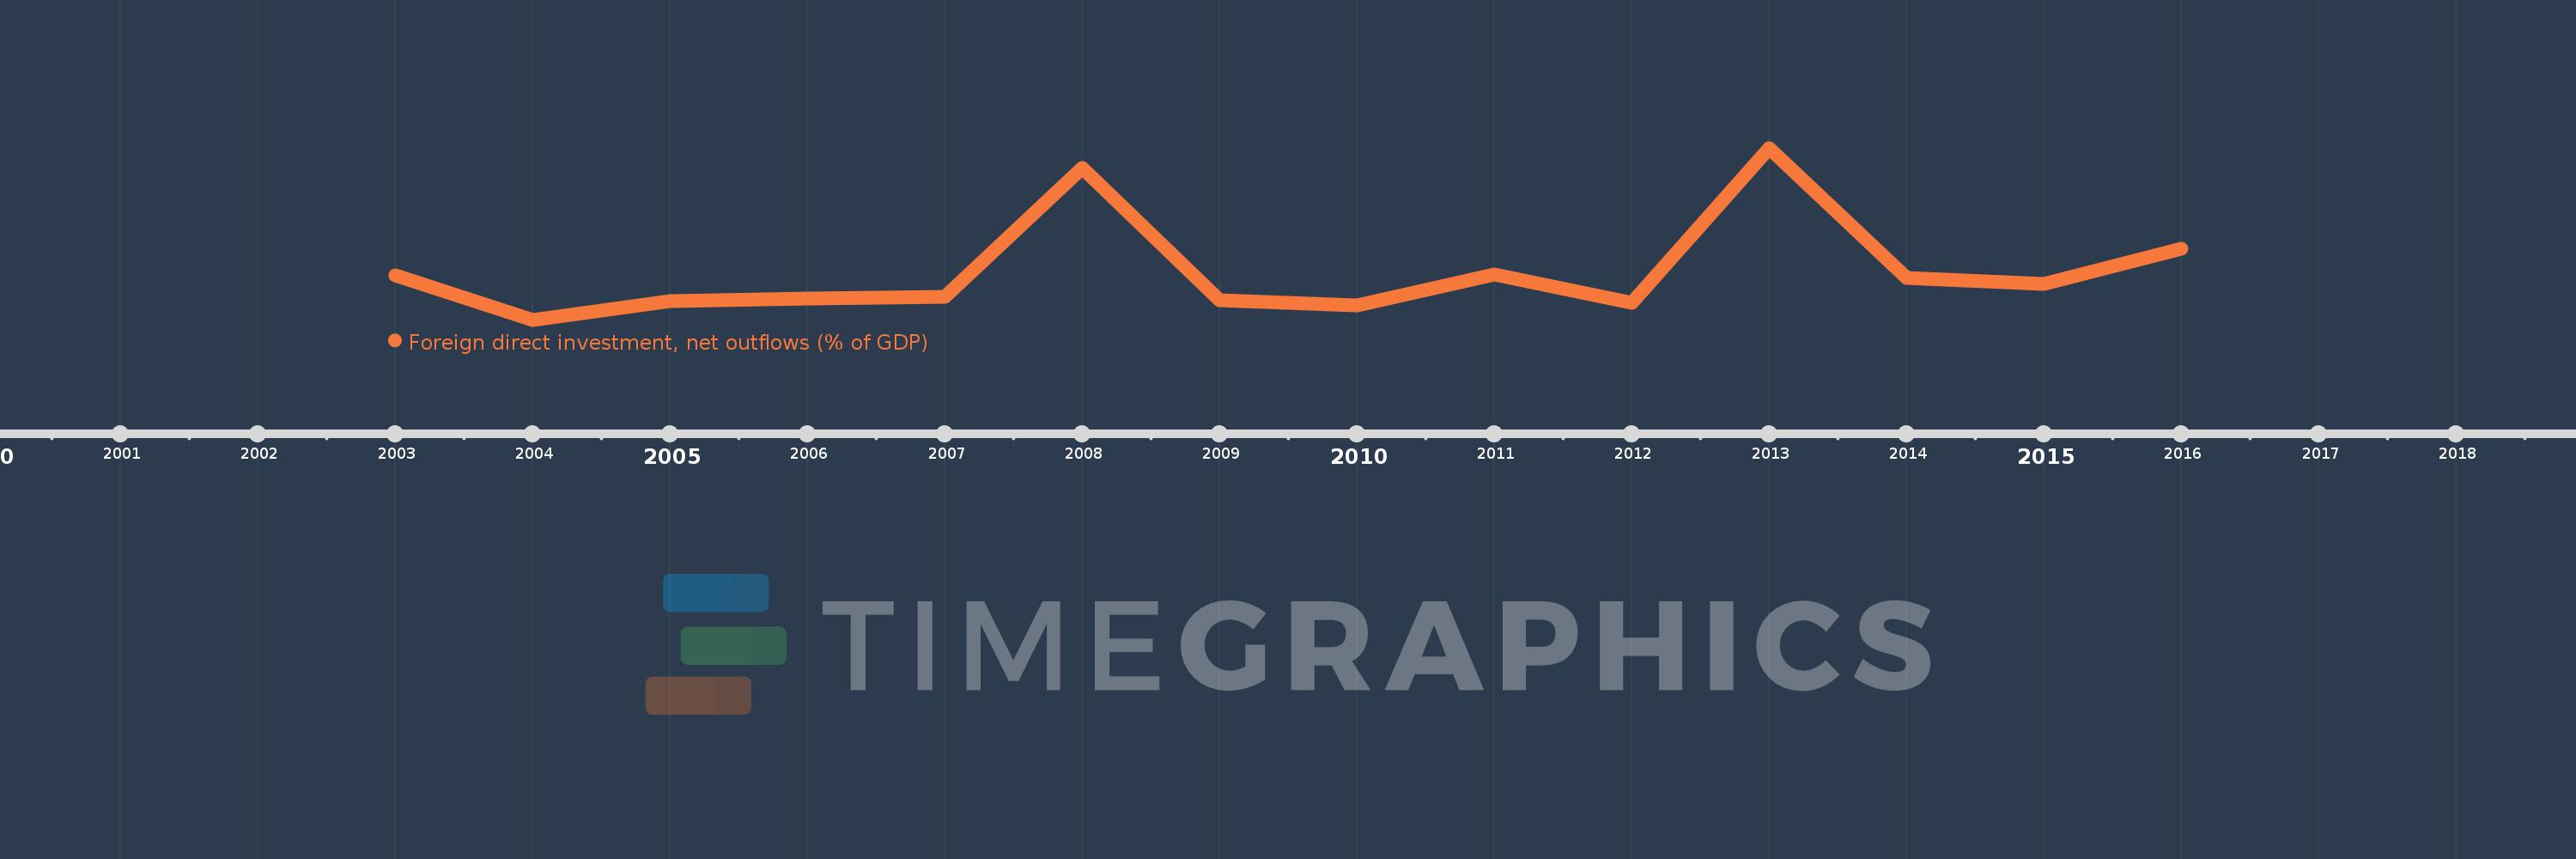
Questa scala temporale mostra un grafico dal 2003 anno al 2016 anno. Luxembourg. I dati fino ad 2002 anno non disponibili. Il numero di osservazioni attuali secondo i date: 14.
La fonte (nome):
Indicatori dello sviluppo mondiale
La fonte (organizzazione):
International Monetary Fund, International Financial Statistics and Balance of Payments databases, World Bank, International Debt Statistics, and World Bank and OECD GDP estimates.
Categorie:
Economy & Growth, Financial Sector
sono stati aggiornati
23 apr 2017 anni
Indicatori delle variazioni dei valori per anni
In media:
47.129
Minima:
2.913
1 gen 2004 anni
Massimo:
160.405
1 gen 2013 anni
Alla data di osservazione
Valore
Variazione assoluta
La variazione rispetto al valore precedente
1 gen 2003 anni
43.836
+43.836
0.0%
1 gen 2004 anni
2.913
-40.923
-93.36%
1 gen 2005 anni
19.722
+16.809
577.11%
1 gen 2006 anni
22.206
+2.484
12.59%
1 gen 2007 anni
23.942
+1.737
7.82%
1 gen 2008 anni
141.672
+117.729
491.72%
1 gen 2009 anni
20.865
-120.806
-85.27%
1 gen 2010 anni
16.41
-4.456
-21.35%
1 gen 2011 anni
44.416
+28.007
170.67%
1 gen 2012 anni
18.256
-26.16
-58.9%
1 gen 2013 anni
160.405
+142.149
778.64%
1 gen 2014 anni
40.914
-119.491
-74.49%
1 gen 2015 anni
36.127
-4.788
-11.7%
1 gen 2016 anni
68.123
+31.996
88.57%
Classificazione dei paesi secondo i statistiche attuali per anni