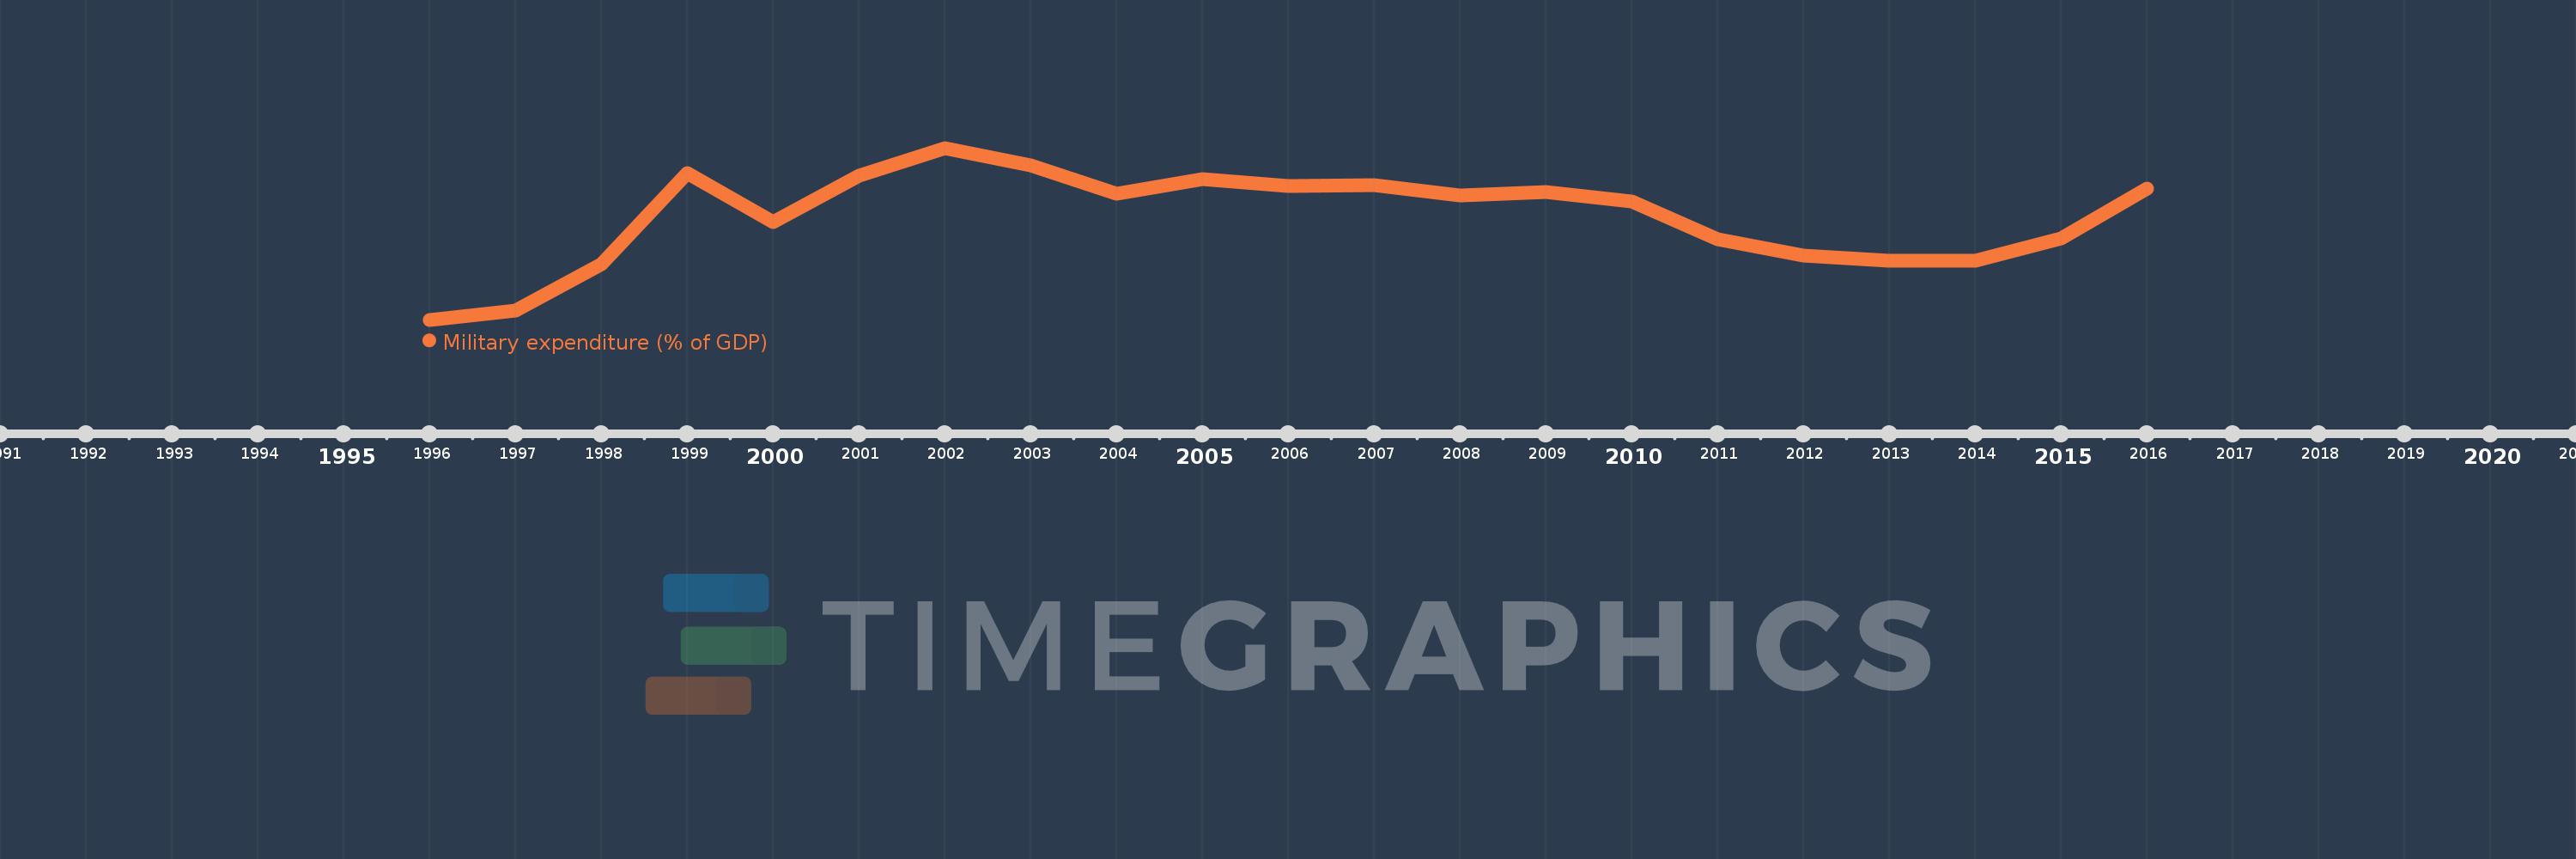
Questa scala temporale mostra un grafico dal 1996 anno al 2016 anno. Lithuania. I dati fino ad 1995 anno non disponibili. Il numero di osservazioni attuali secondo i date: 21.
La fonte (nome):
Indicatori dello sviluppo mondiale
La fonte (organizzazione):
Stockholm International Peace Research Institute (SIPRI), Yearbook: Armaments, Disarmament and International Security.
Categorie:
Public Sector
sono stati aggiornati
23 apr 2017 anni
Indicatori delle variazioni dei valori per anni
In media:
0.998
Minima:
0.454
1 gen 1996 anni
Massimo:
1.362
1 gen 2002 anni
Alla data di osservazione
Valore
Variazione assoluta
La variazione rispetto al valore precedente
1 gen 1996 anni
0.454
+0.454
0.0%
1 gen 1997 anni
0.504
+0.05
10.92%
1 gen 1998 anni
0.747
+0.243
48.24%
1 gen 1999 anni
1.229
+0.482
64.53%
1 gen 2000 anni
0.97
-0.259
-21.08%
1 gen 2001 anni
1.217
+0.247
25.42%
1 gen 2002 anni
1.362
+0.145
11.94%
1 gen 2003 anni
1.271
-0.091
-6.66%
1 gen 2004 anni
1.121
-0.15
-11.8%
1 gen 2005 anni
1.196
+0.075
6.66%
1 gen 2006 anni
1.162
-0.034
-2.82%
1 gen 2007 anni
1.164
+0.002
0.15%
1 gen 2008 anni
1.112
-0.051
-4.42%
1 gen 2009 anni
1.13
+0.018
1.61%
1 gen 2010 anni
1.081
-0.049
-4.34%
1 gen 2011 anni
0.879
-0.202
-18.72%
1 gen 2012 anni
0.792
-0.087
-9.87%
1 gen 2013 anni
0.767
-0.025
-3.17%
1 gen 2014 anni
0.765
-0.002
-0.31%
1 gen 2015 anni
0.883
+0.118
15.47%
1 gen 2016 anni
1.145
+0.262
29.67%
Classificazione dei paesi secondo i statistiche attuali per anni