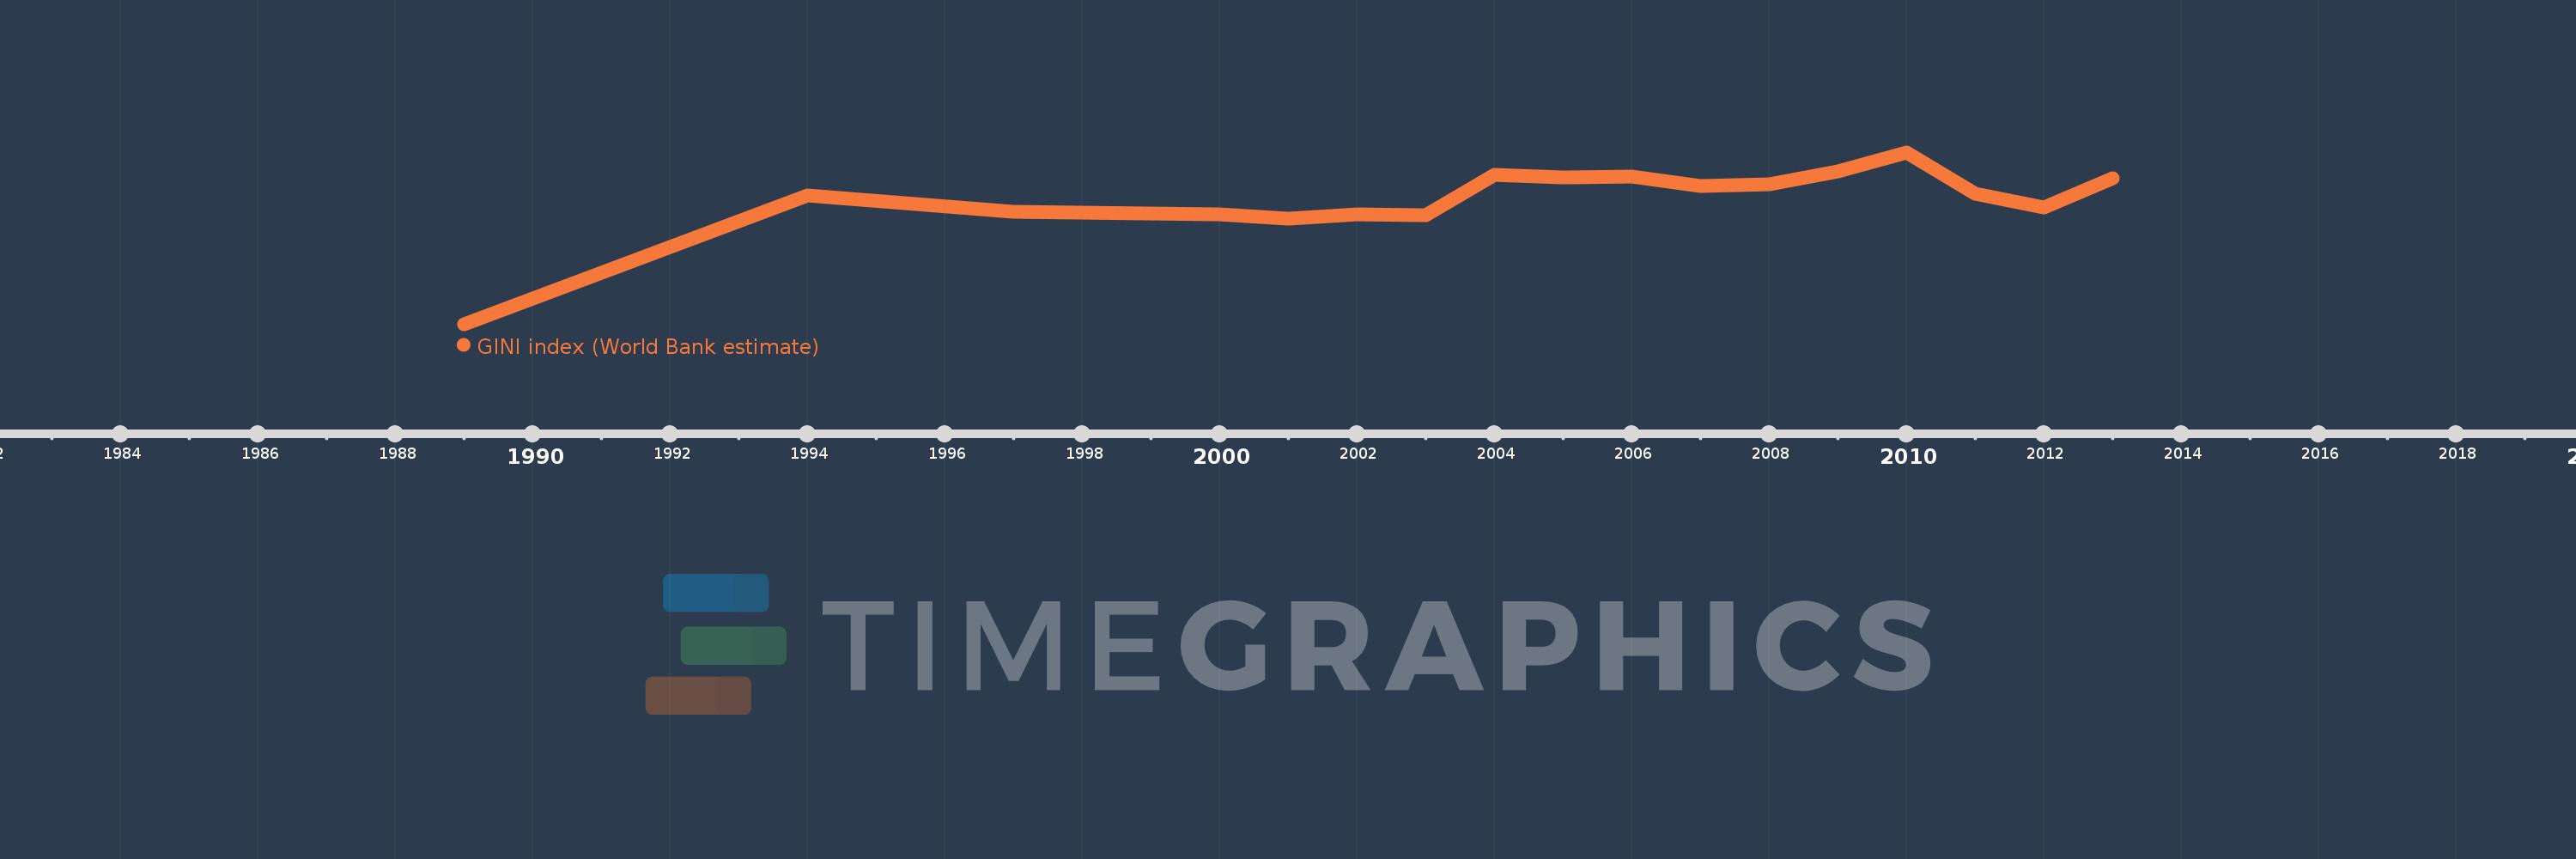
Questa scala temporale mostra un grafico dal 1989 anno al 2013 anno. Lithuania. I dati fino ad 1988 anno non disponibili. Il numero di osservazioni attuali secondo i date: 18.
La fonte (nome):
Indicatori dello sviluppo mondiale
La fonte (organizzazione):
World Bank, Development Research Group. Data are based on primary household survey data obtained from government statistical agencies and World Bank country departments. For more information and methodology, please see PovcalNet (http://iresearch.worldbank.org/PovcalNet/index.htm).
Categorie:
Poverty
sono stati aggiornati
23 apr 2017 anni
Indicatori delle variazioni dei valori per anni
In media:
33.21
Minima:
22.48
1 gen 1989 anni
Massimo:
37.38
1 gen 2010 anni
Alla data di osservazione
Valore
Variazione assoluta
La variazione rispetto al valore precedente
1 gen 1989 anni
22.48
+22.48
0.0%
1 gen 1994 anni
33.64
+11.16
49.64%
1 gen 1997 anni
32.26
-1.38
-4.1%
1 gen 1999 anni
32.1
-0.16
-0.5%
1 gen 2000 anni
32.02
-0.08
-0.25%
1 gen 2001 anni
31.67
-0.35
-1.09%
1 gen 2002 anni
32.01
+0.34
1.07%
1 gen 2003 anni
31.92
-0.09
-0.28%
1 gen 2004 anni
35.46
+3.54
11.09%
1 gen 2005 anni
35.2
-0.26
-0.73%
1 gen 2006 anni
35.3
+0.1
0.28%
1 gen 2007 anni
34.44
-0.86
-2.44%
1 gen 2008 anni
34.59
+0.15
0.44%
1 gen 2009 anni
35.77
+1.18
3.41%
1 gen 2010 anni
37.38
+1.61
4.5%
1 gen 2011 anni
33.76
-3.62
-9.68%
1 gen 2012 anni
32.63
-1.13
-3.35%
1 gen 2013 anni
35.15
+2.52
7.72%
Classificazione dei paesi secondo i statistiche attuali per anni