Download Queste statistiche in altri paesi:
Linea del tempo:
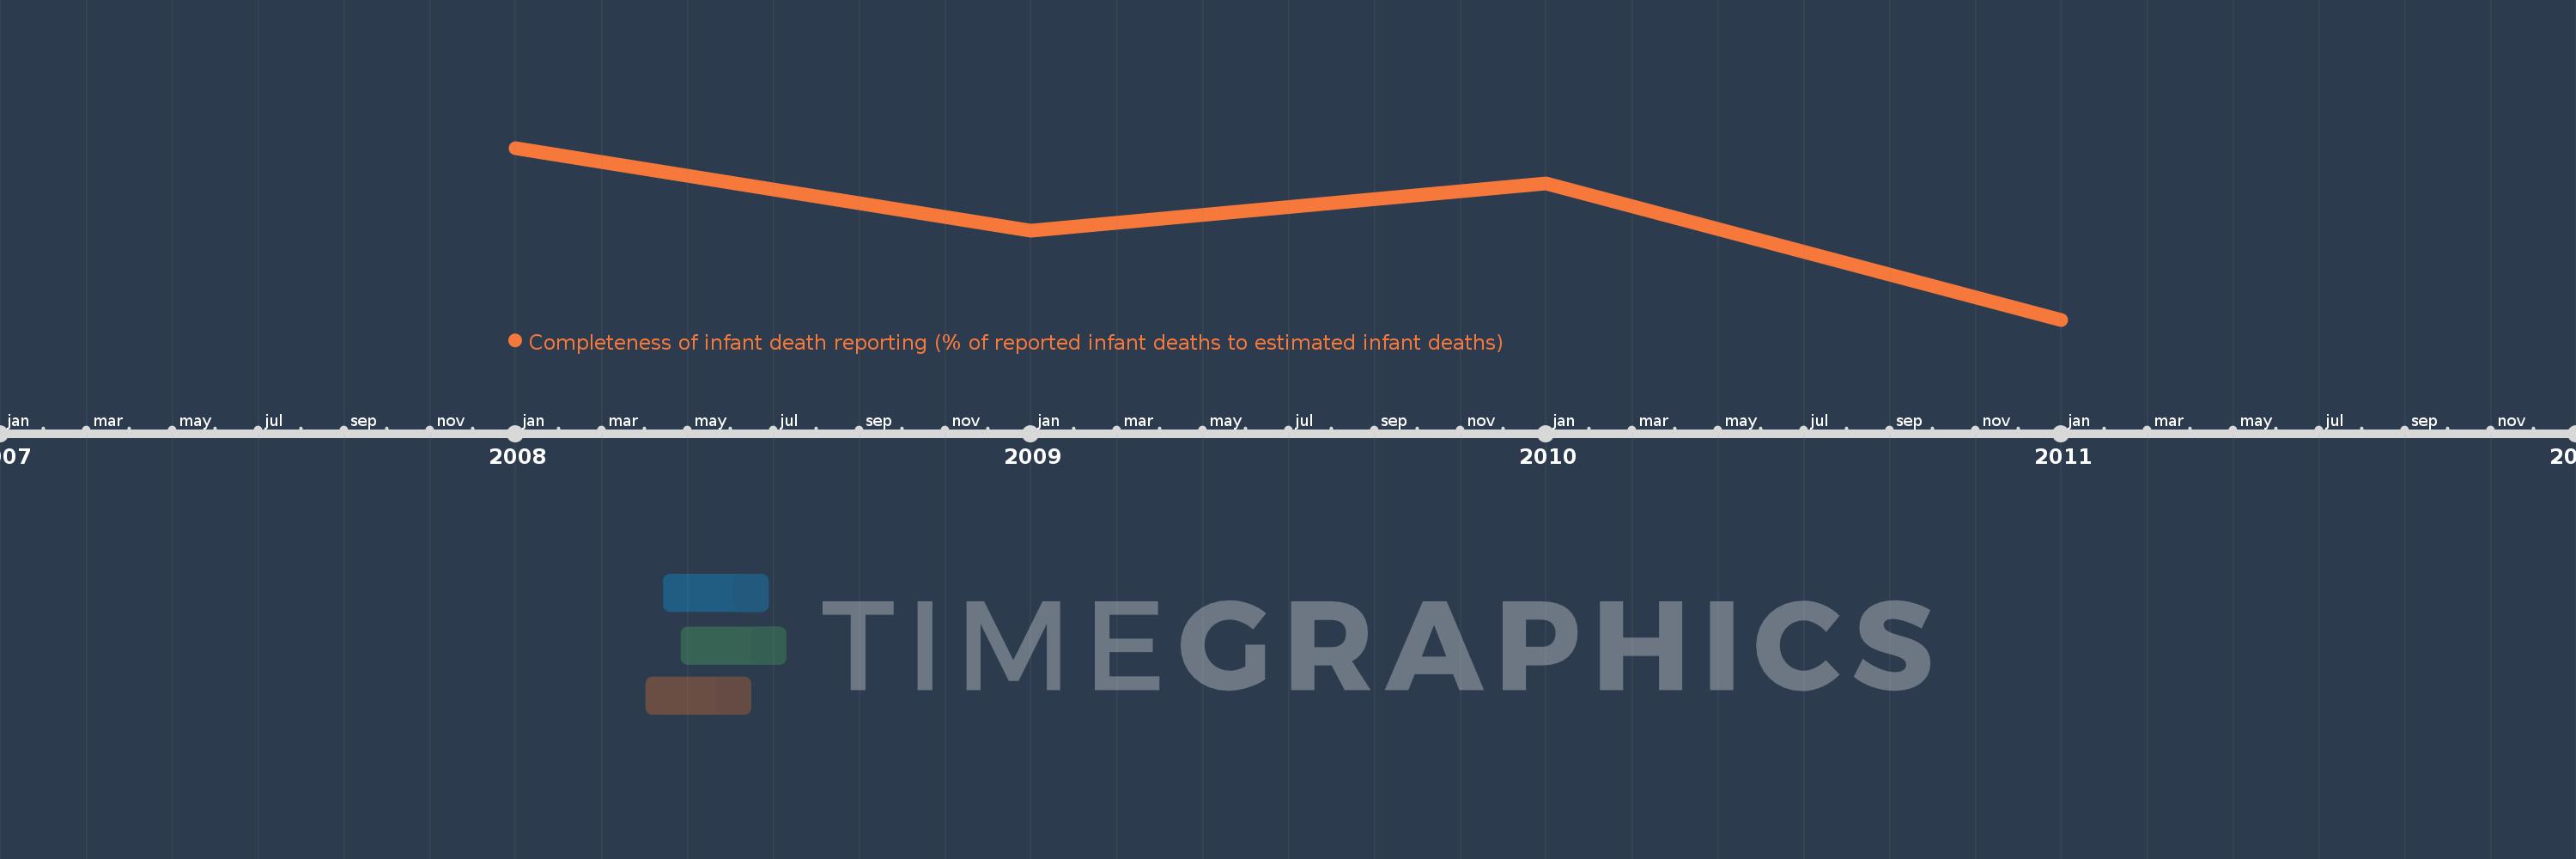
Questa scala temporale mostra un grafico dal 2008 anno al 2011 anno. Lithuania. I dati fino ad 2007 anno non disponibili. Il numero di osservazioni attuali secondo i date: 4.
La fonte (nome):
Indicatori dello sviluppo mondiale
La fonte (organizzazione):
The United Nations Statistics Division's Population and Vital Statistics Report and the United Nations Population Division's World Population Prospects.
Categorie:
Health
sono stati aggiornati
23 apr 2017 anni
Indicatori delle variazioni dei valori per anni
Minima:
71.495
1 gen 2011 anni
Massimo:
87.963
1 gen 2008 anni
Alla data di osservazione
Valore
Variazione assoluta
La variazione rispetto al valore precedente
1 gen 2008 anni
87.963
+87.963
0.0%
1 gen 2009 anni
80.0
-7.963
-9.05%
1 gen 2010 anni
84.579
+4.579
5.72%
1 gen 2011 anni
71.495
-13.084
-15.47%
Classificazione dei paesi secondo i statistiche attuali per anni