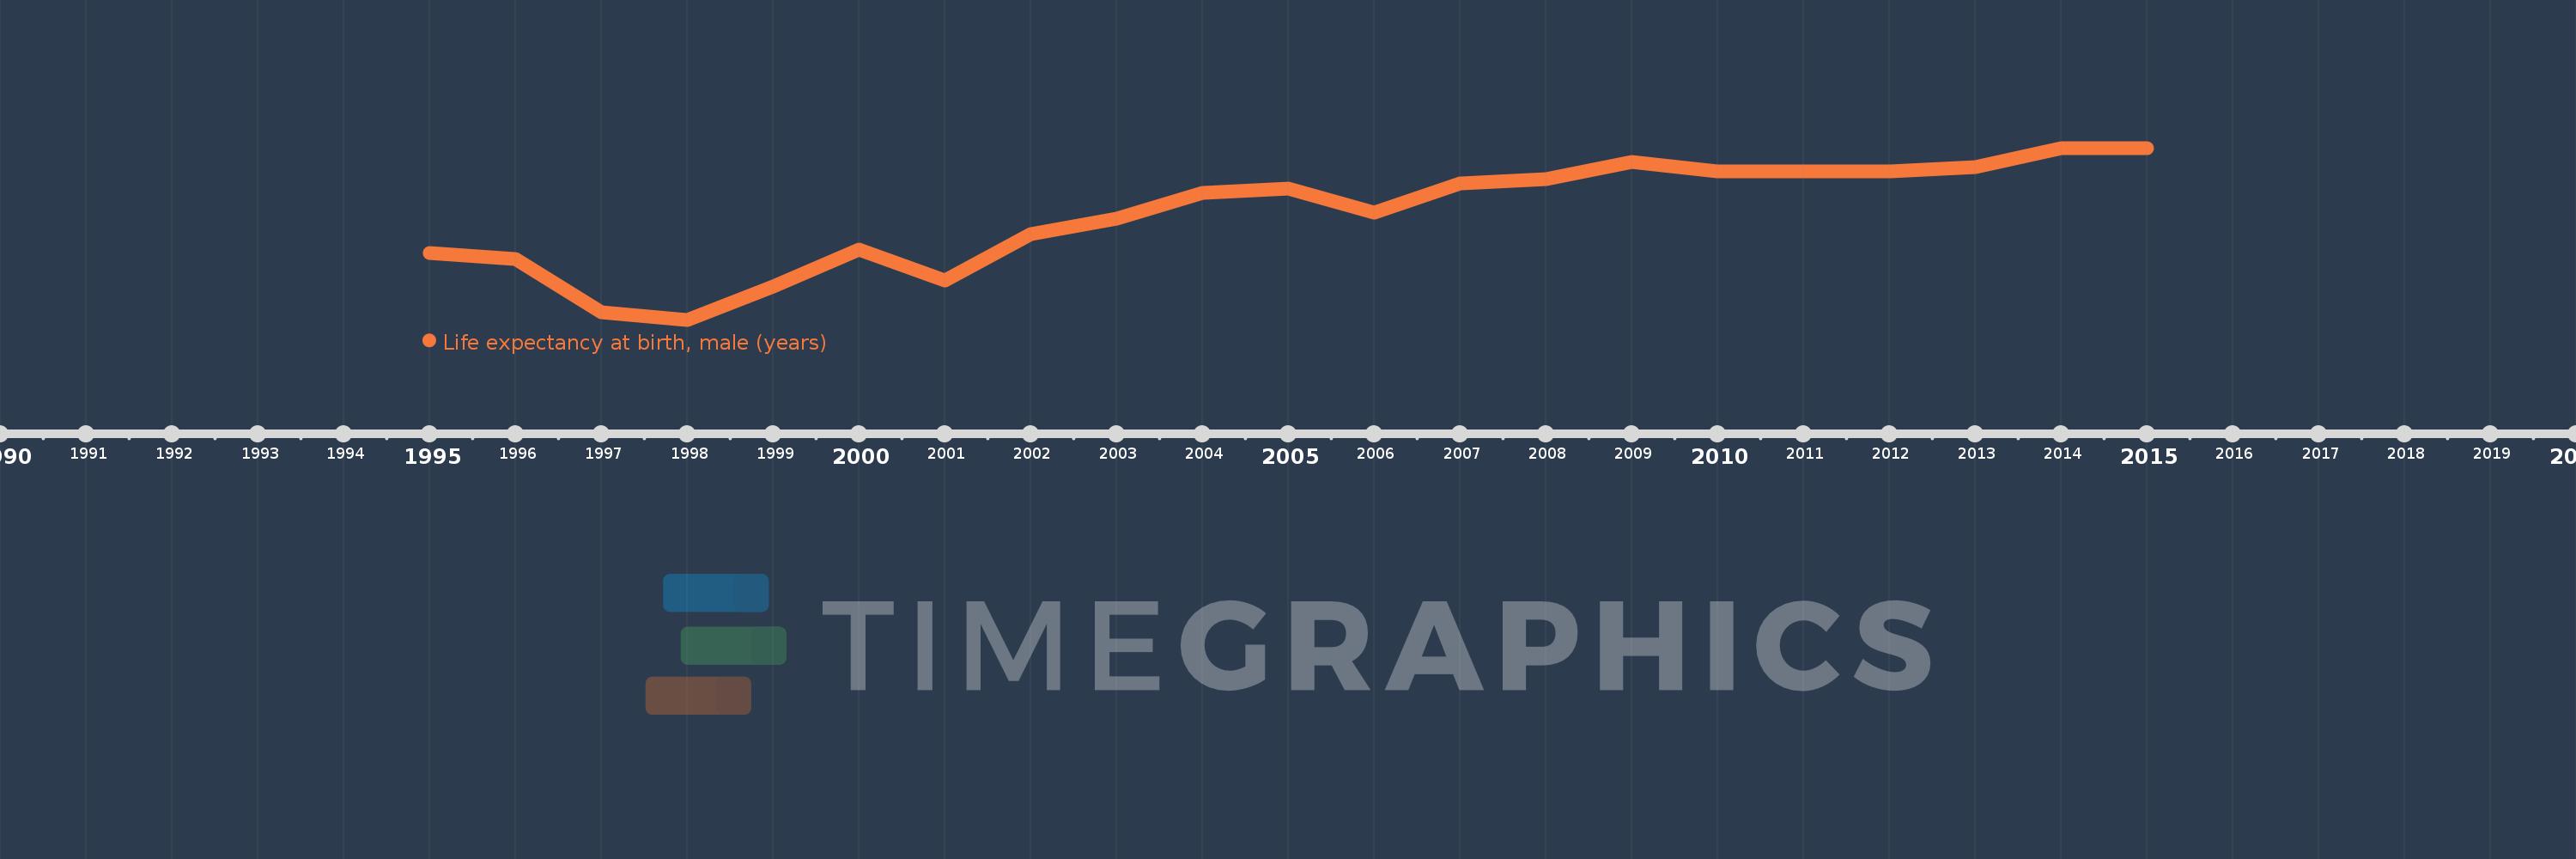
Questa scala temporale mostra un grafico dal 1995 anno al 2015 anno. Liechtenstein. I dati fino ad 1994 anno non disponibili. Il numero di osservazioni attuali secondo i date: 21.
La fonte (nome):
Indicatori dello sviluppo mondiale
La fonte (organizzazione):
(1) United Nations Population Division. World Population Prospects, (2) Census reports and other statistical publications from national statistical offices, (3) Eurostat: Demographic Statistics, (4) United Nations Statistical Division. Population and Vital Statistics Reprot (various years), (5) U.S. Census Bureau: International Database, and (6) Secretariat of the Pacific Community: Statistics and Demography Programme.
Categorie:
Health, Gender, Social Development
sono stati aggiornati
23 apr 2017 anni
Indicatori delle variazioni dei valori per anni
In media:
77.281
Minima:
71.9
1 gen 1998 anni
Massimo:
80.7
1 gen 2014 anni
Alla data di osservazione
Valore
Variazione assoluta
La variazione rispetto al valore precedente
1 gen 1995 anni
75.3
+75.3
0.0%
1 gen 1996 anni
75.0
-0.3
-0.4%
1 gen 1997 anni
72.3
-2.7
-3.6%
1 gen 1998 anni
71.9
-0.4
-0.55%
1 gen 1999 anni
73.6
+1.7
2.36%
1 gen 2000 anni
75.5
+1.9
2.58%
1 gen 2001 anni
73.9
-1.6
-2.12%
1 gen 2002 anni
76.3
+2.4
3.25%
1 gen 2003 anni
77.1
+0.8
1.05%
1 gen 2004 anni
78.4
+1.3
1.69%
1 gen 2005 anni
78.6
+0.2
0.26%
1 gen 2006 anni
77.4
-1.2
-1.53%
1 gen 2007 anni
78.9
+1.5
1.94%
1 gen 2008 anni
79.1
+0.2
0.25%
1 gen 2009 anni
80.0
+0.9
1.14%
1 gen 2010 anni
79.5
-0.5
-0.62%
1 gen 2011 anni
79.5
0.0
0.0%
1 gen 2012 anni
79.5
0.0
0.0%
1 gen 2013 anni
79.7
+0.2
0.25%
1 gen 2014 anni
80.7
+1.0
1.25%
1 gen 2015 anni
80.7
0.0
0.0%
Classificazione dei paesi secondo i statistiche attuali per anni