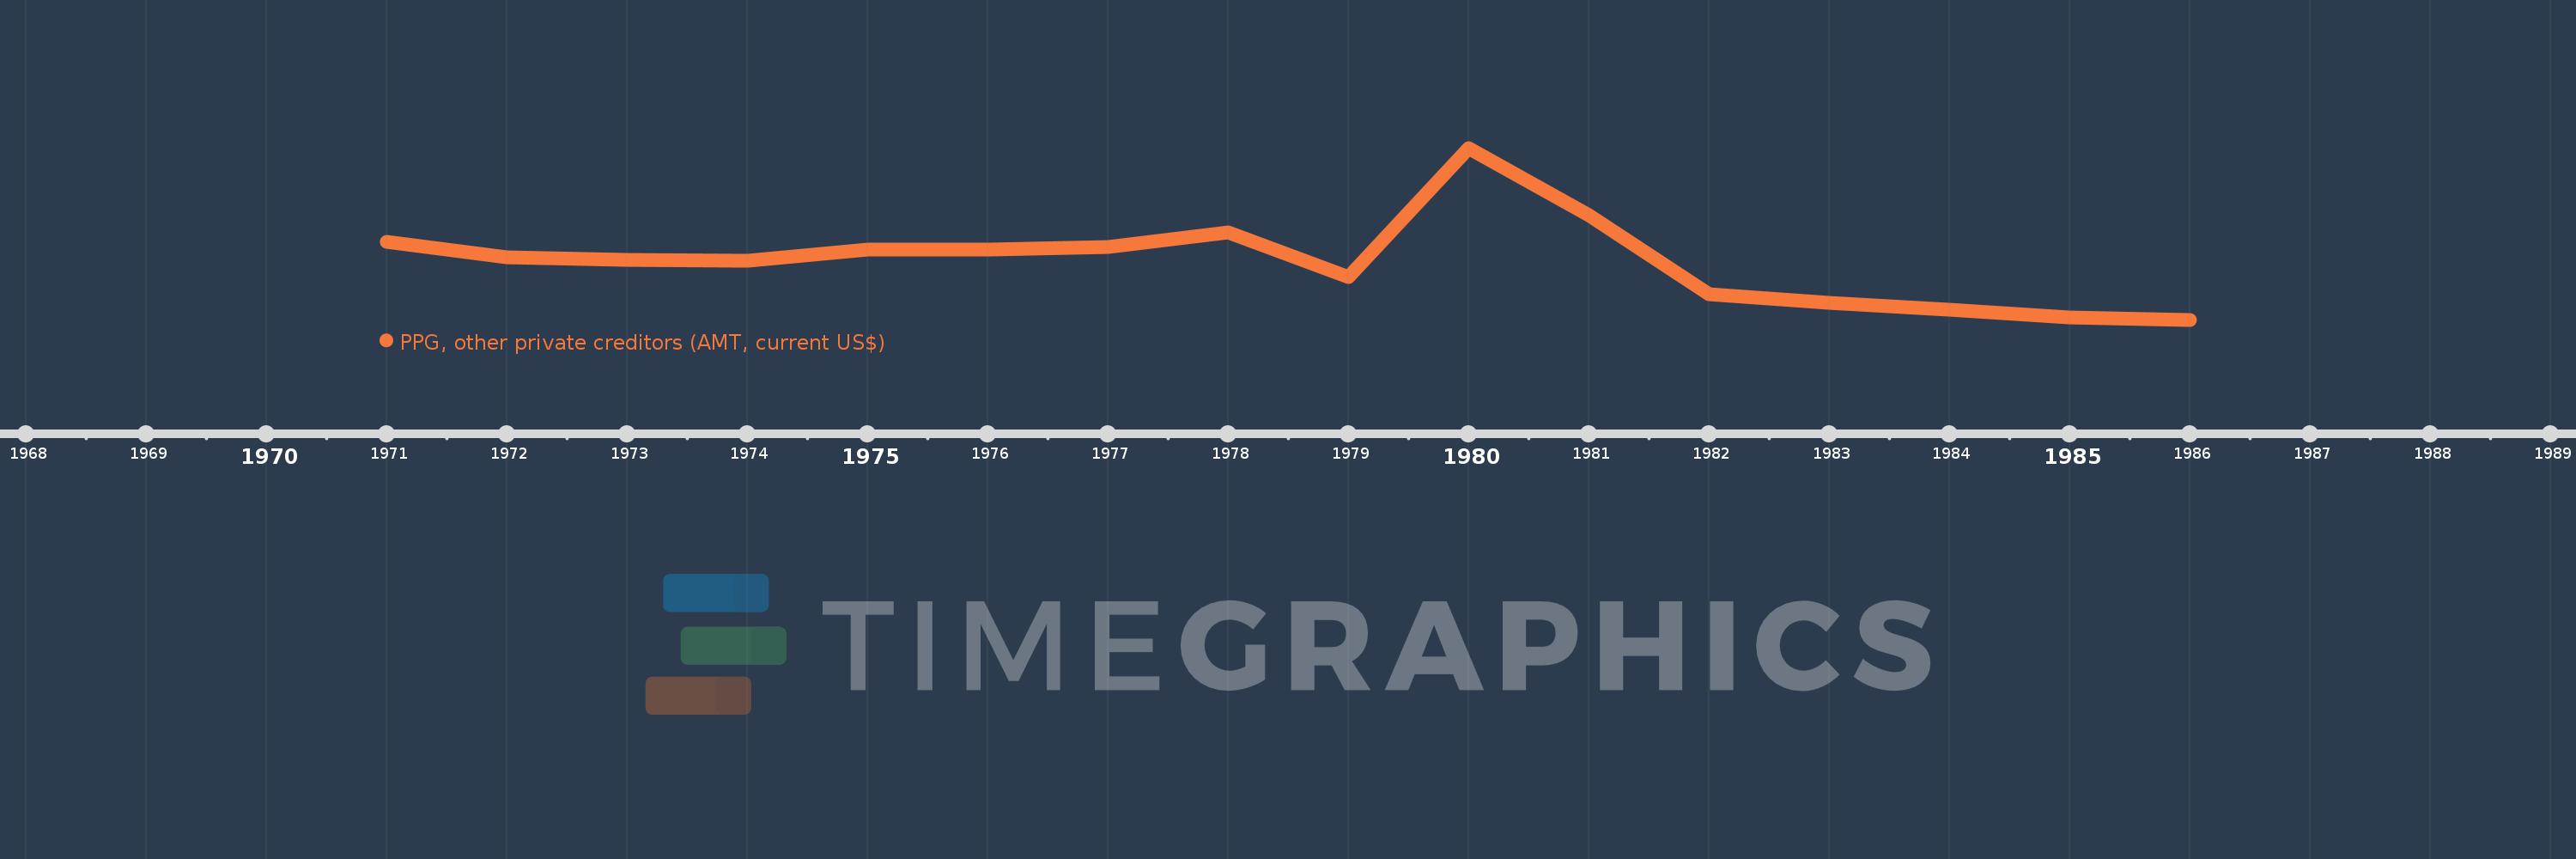
Questa scala temporale mostra un grafico dal 1971 anno al 1986 anno. Liberia. I dati fino ad 1970 anno non disponibili. Il numero di osservazioni attuali secondo i date: 16.
La fonte (nome):
Indicatori dello sviluppo mondiale
La fonte (organizzazione):
World Bank, International Debt Statistics.
Categorie:
External Debt
sono stati aggiornati
23 apr 2017 anni
Indicatori delle variazioni dei valori per anni
In media:
4.88 Mln
Minima:
35.0 Mille.
1 gen 1986 anni
Massimo:
14.326 Mln
1 gen 1980 anni
Alla data di osservazione
Valore
Variazione assoluta
La variazione rispetto al valore precedente
1 gen 1971 anni
6.551 Mln
+6.551 Mln
0.0%
1 gen 1972 anni
5.197 Mln
-1.354 Mln
-20.67%
1 gen 1973 anni
5.038 Mln
-159.0 Mille.
-3.06%
1 gen 1974 anni
4.915 Mln
-123.0 Mille.
-2.44%
1 gen 1975 anni
5.871 Mln
+956.0 Mille.
19.45%
1 gen 1976 anni
5.851 Mln
-20.0 Mille.
-0.34%
1 gen 1977 anni
6.097 Mln
+246.0 Mille.
4.2%
1 gen 1978 anni
7.282 Mln
+1.185 Mln
19.44%
1 gen 1979 anni
3.562 Mln
-3.72 Mln
-51.08%
1 gen 1980 anni
14.326 Mln
+10.764 Mln
302.19%
1 gen 1981 anni
8.709 Mln
-5.617 Mln
-39.21%
1 gen 1982 anni
2.146 Mln
-6.563 Mln
-75.36%
1 gen 1983 anni
1.408 Mln
-738.0 Mille.
-34.39%
1 gen 1984 anni
880.0 Mille.
-528.0 Mille.
-37.5%
1 gen 1985 anni
209.0 Mille.
-671.0 Mille.
-76.25%
1 gen 1986 anni
35.0 Mille.
-174.0 Mille.
-83.25%
Classificazione dei paesi secondo i statistiche attuali per anni