30
/it/
AIzaSyAYiBZKx7MnpbEhh9jyipgxe19OcubqV5w
April 1, 2024
179239
Liberia
LBR
true
2
1
Net official flows from UN agencies, WHO (current US$)
2015,2014,2013,2012
Download
Biblioteca di statistiche globali →Liberia →

Net official flows from UN agencies, WHO (current US$)

Queste statistiche in altri paesi:

AfghanistanAlbaniaAlgeriaAngolaArab WorldArmeniaAzerbaijanBangladeshBelarusBeninBhutanBosnia and HerzegovinaBotswanaBurkina FasoBurundiCabo VerdeCambodiaCameroonCentral African RepublicChadChinaComorosCongo, Dem. Rep.Congo, Rep.Cote d'IvoireDjiboutiEast Asia & PacificEast Asia & Pacific (excluding high income)East Asia & Pacific (IDA & IBRD countries)Egypt, Arab Rep.Equatorial GuineaEritreaEthiopiaEurope & Central AsiaEurope & Central Asia (excluding high income)Europe & Central Asia (IDA & IBRD countries)FijiFragile and conflict affected situationsGabonGambia, TheGeorgiaGhanaGuineaGuinea-BissauHeavily indebted poor countries (HIPC)High incomeIBRD onlyIDA & IBRD totalIDA blendIDA onlyIDA totalIndiaIndonesiaIran, Islamic Rep.IraqJordanKazakhstanKenyaKiribatiKorea, Dem. People’s Rep.KosovoKyrgyz RepublicLao PDRLatin America & Caribbean Latin America & Caribbean (excluding high income)Least developed countries: UN classificationLebanonLesothoLiberiaLibyaLow & middle incomeLow incomeLower middle incomeMacedonia, FYRMadagascarMalawiMalaysiaMaldivesMaliMarshall IslandsMauritaniaMauritiusMicronesia, Fed. Sts.Middle East & North AfricaMiddle East & North Africa (excluding high income)Middle East & North Africa (IDA & IBRD countries)Middle incomeMoldovaMongoliaMontenegroMoroccoMozambiqueMyanmarNamibiaNauruNepalNigerNigeriaNorth AmericaOECD membersOther small statesPacific island small statesPakistanPalauPapua New GuineaPhilippinesRwandaSamoaSao Tome and PrincipeSenegalSerbiaSeychellesSierra LeoneSmall statesSolomon IslandsSomaliaSouth AfricaSouth AsiaSouth Asia (IDA & IBRD)South SudanSri LankaSub-Saharan Africa Sub-Saharan Africa (excluding high income)Sub-Saharan Africa (IDA & IBRD countries)SudanSwazilandSyrian Arab RepublicTajikistanTanzaniaThailandTimor-LesteTogoTongaTunisiaTurkeyTurkmenistanTuvaluUgandaUkraineUpper middle incomeUzbekistanVanuatuVietnamWest Bank and GazaWorldYemen, Rep.ZambiaZimbabwe

Linea del tempo:

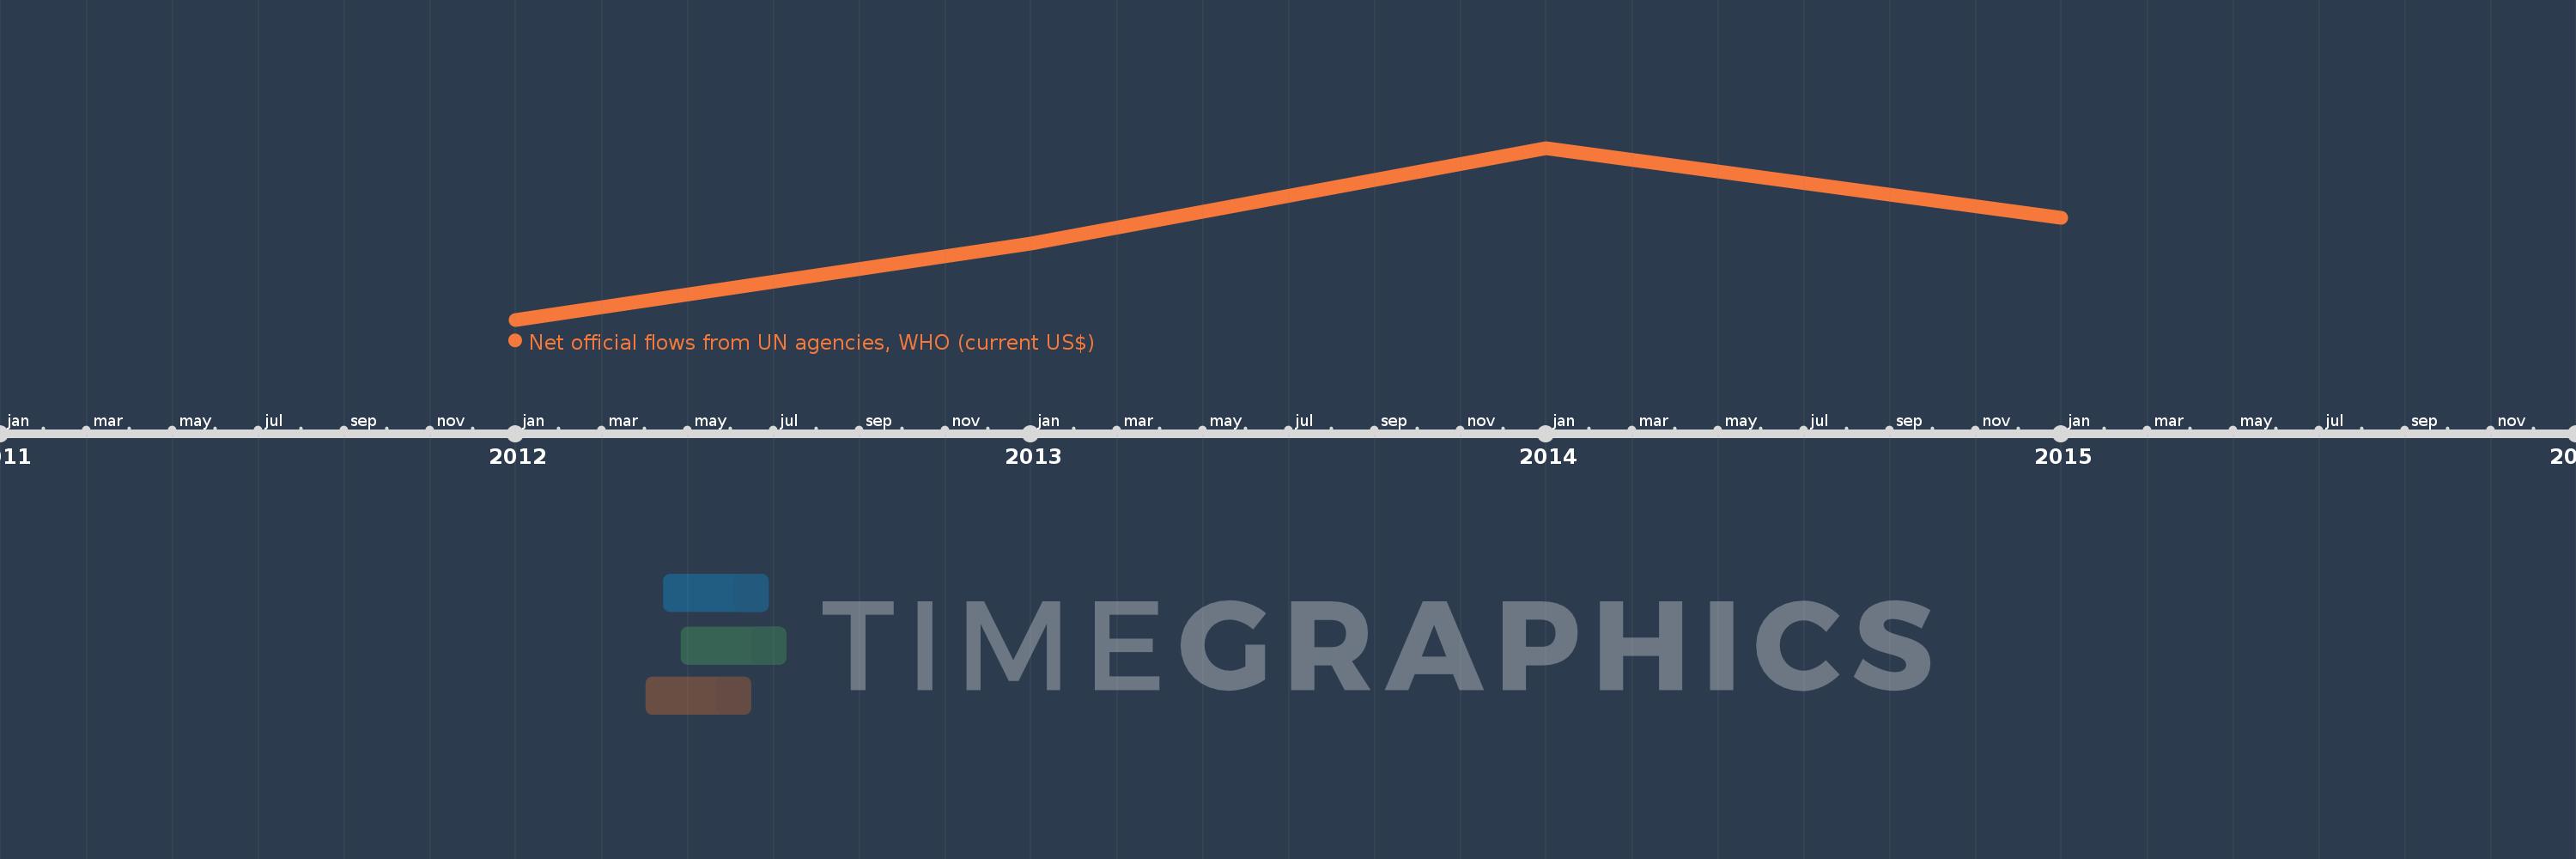
Questa scala temporale mostra un grafico dal 2012 anno al 2015 anno. Liberia. I dati fino ad 2011 anno non disponibili. Il numero di osservazioni attuali secondo i date: 4.

La fonte (nome):

Indicatori dello sviluppo mondiale

La fonte (organizzazione):

Development Assistance Committee of the Organisation for Economic Co-operation and Development, Geographical Distribution of Financial Flows to Developing Countries, Development Co-operation Report, and International Development Statistics database. Data are available online at: www.oecd.org/dac/stats/idsonline.

Categorie:

Aid Effectiveness

sono stati aggiornati

23 apr 2017 anni

Indicatori delle variazioni dei valori per anni

In media:
1.238 Mln
Minima:
860.0 Mille.
1 gen 2012 anni
Massimo:
1.6 Mln
1 gen 2014 anni
Alla data di osservazione
Valore
Variazione assoluta
La variazione rispetto al valore precedente
1 gen 2012 anni
860.0 Mille.
+860.0 Mille.
0.0%
1 gen 2013 anni
1.19 Mln
+330.0 Mille.
38.37%
1 gen 2014 anni
1.6 Mln
+410.0 Mille.
34.45%
1 gen 2015 anni
1.3 Mln
-300.0 Mille.
-18.75%

Classificazione dei paesi secondo i statistiche attuali per anni