30
/it/
AIzaSyAYiBZKx7MnpbEhh9jyipgxe19OcubqV5w
April 1, 2024
178032
Lesotho
LSO
true
2
1
Newborns protected against tetanus (%)
2016,2015,2014,2013,2012,2011,2010,2009,2008,2007,2006,2005,2004,2003,2002,2001,2000,1999,1998,1997,1996,1995,1994,1993,1992
Download
Biblioteca di statistiche globali →Lesotho →

Newborns protected against tetanus (%)

Queste statistiche in altri paesi:

AfghanistanAlbaniaAlgeriaAngolaArab WorldBahamas, TheBahrainBangladeshBelizeBeninBhutanBoliviaBotswanaBrazilBrunei DarussalamBurkina FasoBurundiCabo VerdeCambodiaCameroonCaribbean small statesCentral African RepublicChadColombiaComorosCongo, Dem. Rep.Congo, Rep.Cote d'IvoireDjiboutiDominican RepublicEarly-demographic dividendEcuadorEgypt, Arab Rep.El SalvadorEquatorial GuineaEritreaEthiopiaFijiFragile and conflict affected situationsGabonGambia, TheGhanaGuatemalaGuineaGuinea-BissauGuyanaHaitiHeavily indebted poor countries (HIPC)HondurasIDA & IBRD totalIDA blendIDA onlyIDA totalIndiaIndonesiaIran, Islamic Rep.IraqJamaicaJordanKenyaKiribatiKorea, Dem. People’s Rep.KuwaitLao PDRLatin America & Caribbean Latin America & Caribbean (excluding high income)Latin America & the Caribbean (IDA & IBRD countries)Least developed countries: UN classificationLesothoLiberiaLow & middle incomeLow incomeLower middle incomeMadagascarMalawiMalaysiaMaldivesMaliMauritaniaMauritiusMexicoMiddle East & North AfricaMiddle East & North Africa (excluding high income)Middle East & North Africa (IDA & IBRD countries)Middle incomeMoroccoMozambiqueMyanmarNamibiaNepalNicaraguaNigerNigeriaOmanOther small statesPacific island small statesPakistanPapua New GuineaParaguayPeruPhilippinesPre-demographic dividendRwandaSao Tome and PrincipeSenegalSeychellesSierra LeoneSmall statesSolomon IslandsSomaliaSouth AfricaSouth AsiaSouth Asia (IDA & IBRD)South SudanSri LankaSub-Saharan Africa Sub-Saharan Africa (excluding high income)Sub-Saharan Africa (IDA & IBRD countries)SudanSurinameSwazilandSyrian Arab RepublicTanzaniaThailandTimor-LesteTogoTunisiaTurkeyUgandaVanuatuVenezuela, RBVietnamYemen, Rep.ZambiaZimbabwe

Linea del tempo:

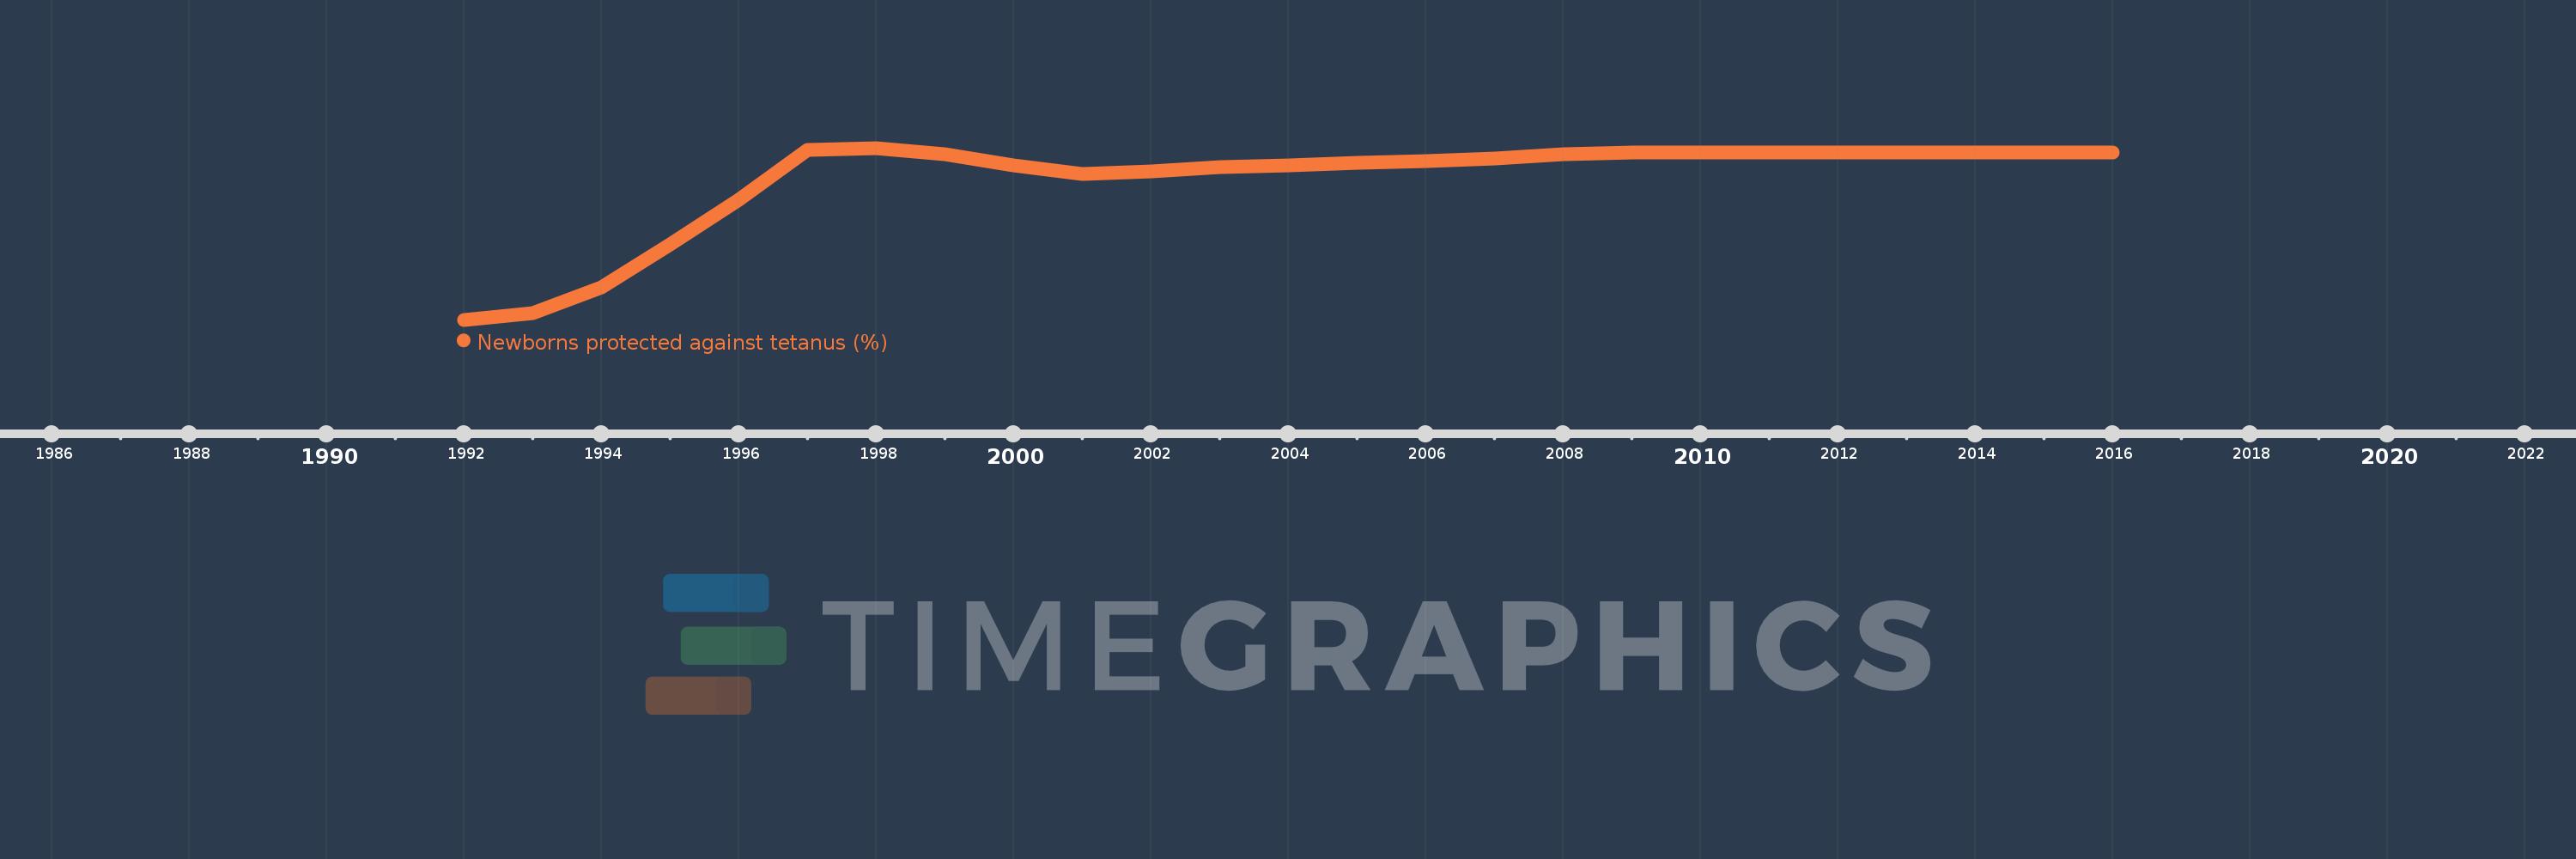
Questa scala temporale mostra un grafico dal 1992 anno al 2016 anno. Lesotho. I dati fino ad 1991 anno non disponibili. Il numero di osservazioni attuali secondo i date: 25.

La fonte (nome):

Indicatori dello sviluppo mondiale

La fonte (organizzazione):

WHO and UNICEF (http://www.who.int/immunization/monitoring_surveillance/en/).

Categorie:

Health

sono stati aggiornati

23 apr 2017 anni

Indicatori delle variazioni dei valori per anni

In media:
69.8
Minima:
5.0
1 gen 1992 anni
Massimo:
85.0
1 gen 1998 anni
Alla data di osservazione
Valore
Variazione assoluta
La variazione rispetto al valore precedente
1 gen 1992 anni
5.0
+5.0
0.0%
1 gen 1993 anni
8.0
+3.0
60.0%
1 gen 1994 anni
20.0
+12.0
150.0%
1 gen 1995 anni
40.0
+20.0
100.0%
1 gen 1996 anni
61.0
+21.0
52.5%
1 gen 1997 anni
84.0
+23.0
37.7%
1 gen 1998 anni
85.0
+1.0
1.19%
1 gen 1999 anni
82.0
-3.0
-3.53%
1 gen 2000 anni
77.0
-5.0
-6.1%
1 gen 2001 anni
73.0
-4.0
-5.19%
1 gen 2002 anni
74.0
+1.0
1.37%
1 gen 2003 anni
76.0
+2.0
2.7%
1 gen 2004 anni
77.0
+1.0
1.32%
1 gen 2005 anni
78.0
+1.0
1.3%
1 gen 2006 anni
79.0
+1.0
1.28%
1 gen 2007 anni
80.0
+1.0
1.27%
1 gen 2008 anni
82.0
+2.0
2.5%
1 gen 2009 anni
83.0
+1.0
1.22%
1 gen 2010 anni
83.0
0.0
0.0%
1 gen 2011 anni
83.0
0.0
0.0%
1 gen 2012 anni
83.0
0.0
0.0%
1 gen 2013 anni
83.0
0.0
0.0%
1 gen 2014 anni
83.0
0.0
0.0%
1 gen 2015 anni
83.0
0.0
0.0%
1 gen 2016 anni
83.0
0.0
0.0%

Classificazione dei paesi secondo i statistiche attuali per anni