33
/it/
AIzaSyAYiBZKx7MnpbEhh9jyipgxe19OcubqV5w
August 1, 2025
177051
Lebanon
LBN
true
2
1
Revenue, excluding grants (% of GDP)
2016,2015,2014,2013,2012,2011,2010,2009,2008,2007,2006,2005,2004,2003,2002,2001,2000,1999,1998
Download
Biblioteca di statistiche globali →Lebanon →

Revenue, excluding grants (% of GDP)

Queste statistiche in altri paesi:

AfghanistanAlbaniaAlgeriaAngolaAntigua and BarbudaArgentinaArmeniaAustraliaAustriaAzerbaijanBahamas, TheBahrainBangladeshBarbadosBelarusBelgiumBelizeBeninBhutanBoliviaBosnia and HerzegovinaBotswanaBrazilBulgariaBurkina FasoBurundiCabo VerdeCambodiaCanadaCaribbean small statesCentral African RepublicCentral Europe and the BalticsChileChinaColombiaCongo, Dem. Rep.Congo, Rep.Costa RicaCote d'IvoireCroatiaCyprusCzech RepublicDenmarkDominicaDominican RepublicEarly-demographic dividendEast Asia & PacificEast Asia & Pacific (excluding high income)East Asia & Pacific (IDA & IBRD countries)Egypt, Arab Rep.El SalvadorEquatorial GuineaEstoniaEthiopiaEuro areaEurope & Central AsiaEurope & Central Asia (excluding high income)Europe & Central Asia (IDA & IBRD countries)European UnionFijiFinlandFranceGambia, TheGeorgiaGermanyGhanaGreeceGrenadaGuatemalaHeavily indebted poor countries (HIPC)High incomeHondurasHong Kong SAR, ChinaHungaryIBRD onlyIcelandIDA & IBRD totalIDA blendIDA onlyIDA totalIndiaIndonesiaIran, Islamic Rep.IraqIrelandIsraelItalyJamaicaJapanJordanKazakhstanKenyaKiribatiKorea, Rep.KuwaitKyrgyz RepublicLao PDRLate-demographic dividendLatin America & Caribbean Latin America & Caribbean (excluding high income)Latin America & the Caribbean (IDA & IBRD countries)LatviaLeast developed countries: UN classificationLebanonLesothoLiberiaLithuaniaLow & middle incomeLow incomeLower middle incomeLuxembourgMacao SAR, ChinaMacedonia, FYRMadagascarMalawiMalaysiaMaldivesMaliMaltaMauritiusMexicoMicronesia, Fed. Sts.Middle East & North Africa (excluding high income)Middle East & North Africa (IDA & IBRD countries)Middle incomeMoldovaMongoliaMoroccoMozambiqueMyanmarNamibiaNepalNetherlandsNew ZealandNicaraguaNigeriaNorth AmericaNorwayOECD membersOmanOther small statesPacific island small statesPakistanPanamaPapua New GuineaParaguayPeruPhilippinesPolandPortugalPost-demographic dividendPre-demographic dividendQatarRomaniaRussian FederationRwandaSamoaSan MarinoSao Tome and PrincipeSenegalSerbiaSeychellesSierra LeoneSingaporeSlovak RepublicSloveniaSmall statesSolomon IslandsSouth AfricaSouth AsiaSouth Asia (IDA & IBRD)SpainSri LankaSt. Kitts and NevisSt. LuciaSt. Vincent and the GrenadinesSub-Saharan Africa Sub-Saharan Africa (excluding high income)Sub-Saharan Africa (IDA & IBRD countries)SurinameSwazilandSwedenSwitzerlandSyrian Arab RepublicTajikistanTanzaniaThailandTimor-LesteTogoTrinidad and TobagoTunisiaTurkeyUgandaUkraineUnited Arab EmiratesUnited KingdomUnited StatesUpper middle incomeUruguayVanuatuVenezuela, RBVietnamWest Bank and GazaWorldYemen, Rep.ZambiaZimbabwe

Linea del tempo:

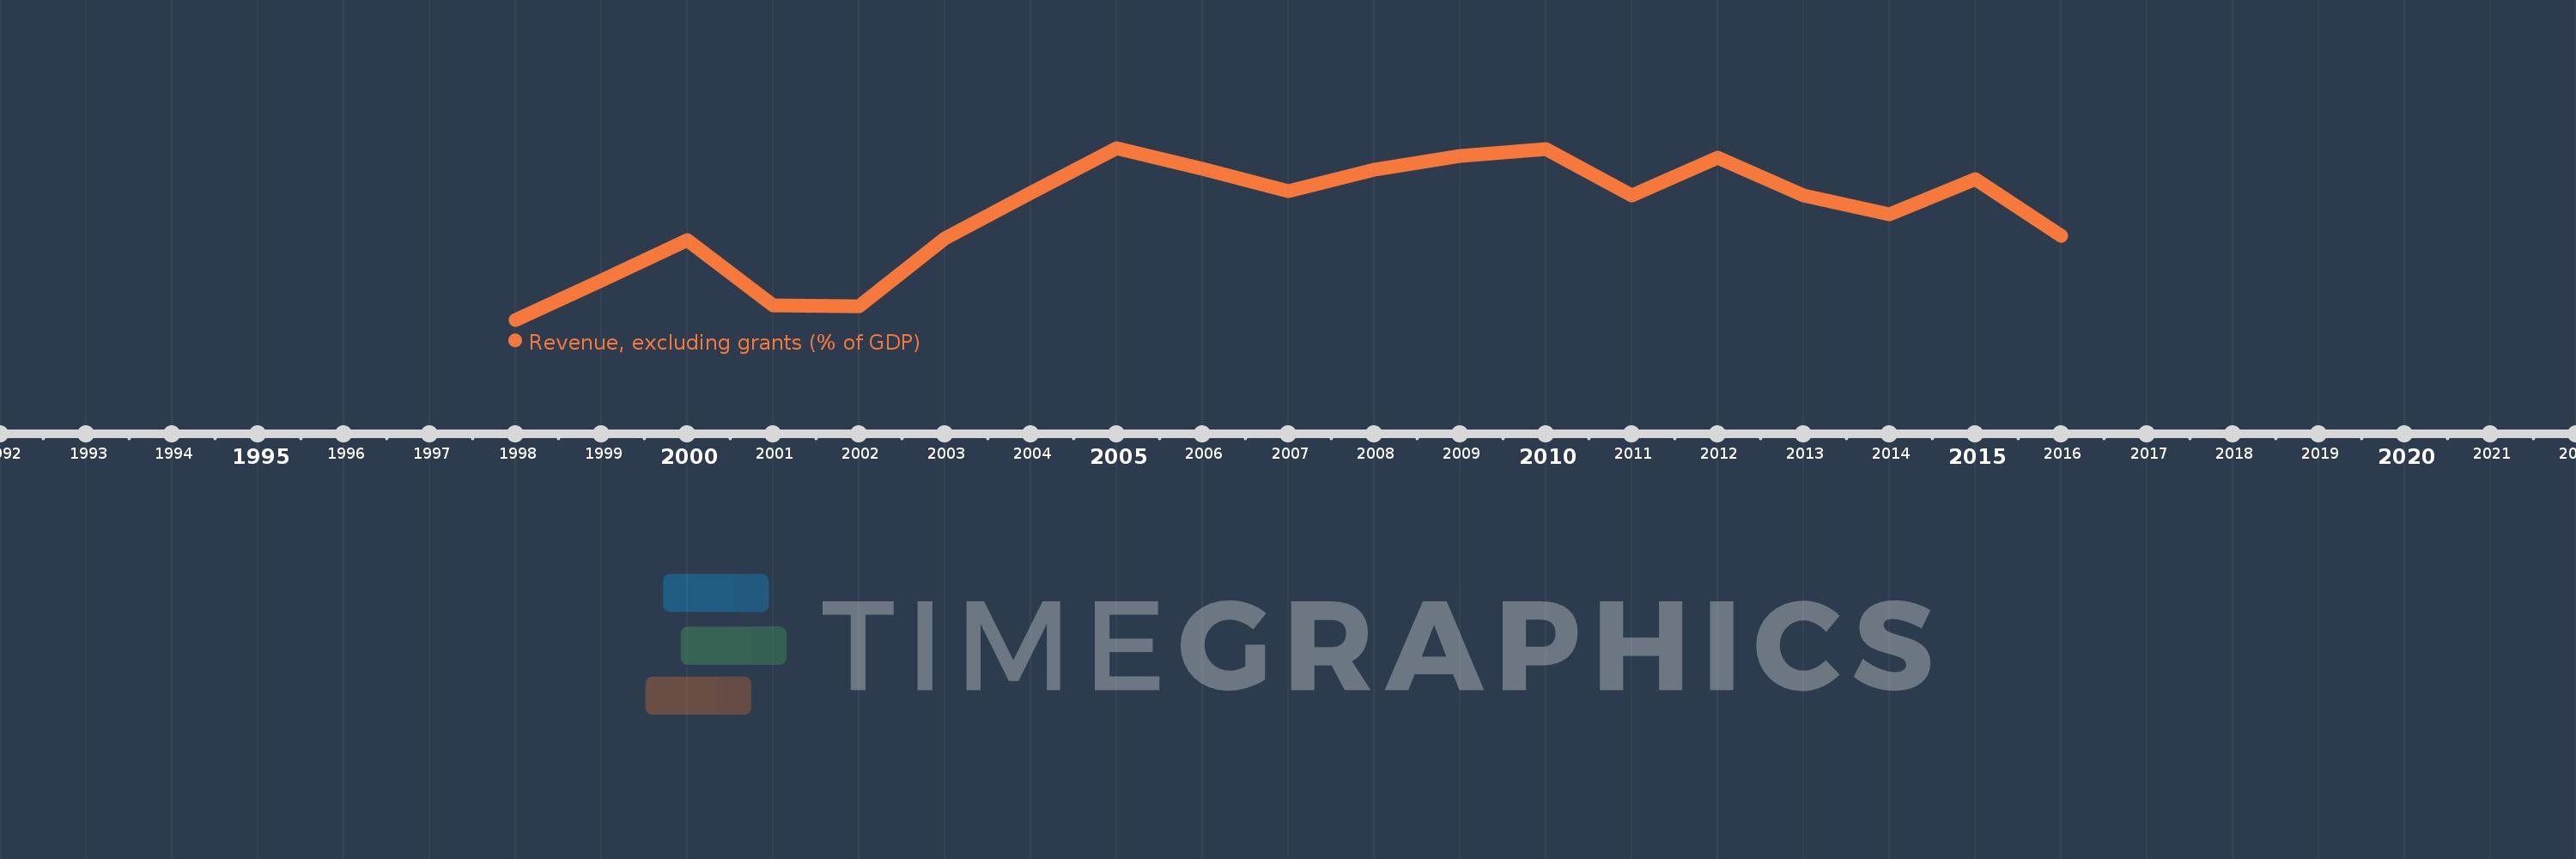
Questa scala temporale mostra un grafico dal 1998 anno al 2016 anno. Lebanon. I dati fino ad 1997 anno non disponibili. Il numero di osservazioni attuali secondo i date: 19.

La fonte (nome):

Indicatori dello sviluppo mondiale

La fonte (organizzazione):

International Monetary Fund, Government Finance Statistics Yearbook and data files, and World Bank and OECD GDP estimates.

Categorie:

Economy & Growth, Public Sector

sono stati aggiornati

23 apr 2017 anni

Indicatori delle variazioni dei valori per anni

In media:
19.634
Minima:
15.477
1 gen 1998 anni
Massimo:
22.159
1 gen 2005 anni
Alla data di osservazione
Valore
Variazione assoluta
La variazione rispetto al valore precedente
1 gen 1998 anni
15.477
+15.477
0.0%
1 gen 1999 anni
17.015
+1.538
9.94%
1 gen 2000 anni
18.565
+1.549
9.1%
1 gen 2001 anni
16.031
-2.534
-13.65%
1 gen 2002 anni
16.009
-0.022
-0.14%
1 gen 2003 anni
18.652
+2.643
16.51%
1 gen 2004 anni
20.415
+1.763
9.45%
1 gen 2005 anni
22.159
+1.744
8.54%
1 gen 2006 anni
21.352
-0.807
-3.64%
1 gen 2007 anni
20.481
-0.872
-4.08%
1 gen 2008 anni
21.305
+0.824
4.03%
1 gen 2009 anni
21.834
+0.529
2.48%
1 gen 2010 anni
22.108
+0.274
1.25%
1 gen 2011 anni
20.304
-1.804
-8.16%
1 gen 2012 anni
21.777
+1.473
7.26%
1 gen 2013 anni
20.319
-1.459
-6.7%
1 gen 2014 anni
19.56
-0.759
-3.73%
1 gen 2015 anni
20.947
+1.387
7.09%
1 gen 2016 anni
18.741
-2.206
-10.53%

Classificazione dei paesi secondo i statistiche attuali per anni