30
/it/
AIzaSyAYiBZKx7MnpbEhh9jyipgxe19OcubqV5w
April 1, 2024
176650
Lebanon
LBN
true
2
1
Manufacturing, value added (constant LCU)
2016,2015,2014,2013,2012,2011,2010,2009,2008,2007,2006,2005,2004,2003,2002,2001,2000,1999,1998,1997,1996,1995
Download
Biblioteca di statistiche globali →Lebanon →

Manufacturing, value added (constant LCU)

Queste statistiche in altri paesi:

AfghanistanAlbaniaAlgeriaAntigua and BarbudaArgentinaArmeniaAustraliaAustriaAzerbaijanBahamas, TheBahrainBangladeshBelarusBelgiumBelizeBeninBermudaBhutanBoliviaBosnia and HerzegovinaBotswanaBrazilBrunei DarussalamBurkina FasoBurundiCabo VerdeCambodiaCameroonCanadaCayman IslandsCentral African RepublicChadChileColombiaComorosCongo, Dem. Rep.Congo, Rep.Costa RicaCote d'IvoireCroatiaCubaCyprusCzech RepublicDenmarkDjiboutiDominicaDominican RepublicEcuadorEgypt, Arab Rep.El SalvadorEquatorial GuineaEritreaEstoniaEthiopiaFijiFinlandFranceGabonGambia, TheGeorgiaGermanyGhanaGreeceGrenadaGuatemalaGuineaGuyanaHaitiHondurasHong Kong SAR, ChinaHungaryIcelandIndiaIndonesiaIran, Islamic Rep.IraqIrelandItalyJamaicaJapanJordanKazakhstanKenyaKiribatiKorea, Rep.KosovoKuwaitKyrgyz RepublicLao PDRLatviaLebanonLesothoLiberiaLibyaLithuaniaLuxembourgMacedonia, FYRMadagascarMalawiMalaysiaMaldivesMarshall IslandsMauritaniaMauritiusMexicoMicronesia, Fed. Sts.MoldovaMongoliaMontenegroMoroccoMozambiqueMyanmarNamibiaNepalNetherlandsNew ZealandNicaraguaNigerNigeriaNorwayOmanPakistanPalauPanamaPapua New GuineaParaguayPeruPhilippinesPolandPortugalPuerto RicoQatarRomaniaRussian FederationRwandaSamoaSao Tome and PrincipeSaudi ArabiaSenegalSerbiaSeychellesSierra LeoneSingaporeSlovak RepublicSloveniaSolomon IslandsSomaliaSouth AfricaSpainSri LankaSt. Kitts and NevisSt. LuciaSt. Vincent and the GrenadinesSudanSurinameSwazilandSwedenSwitzerlandSyrian Arab RepublicTajikistanTanzaniaThailandTimor-LesteTogoTongaTrinidad and TobagoTunisiaTurkeyTuvaluUgandaUkraineUnited Arab EmiratesUnited KingdomUnited StatesUruguayUzbekistanVanuatuVenezuela, RBVietnamWest Bank and GazaZambiaZimbabwe

Linea del tempo:

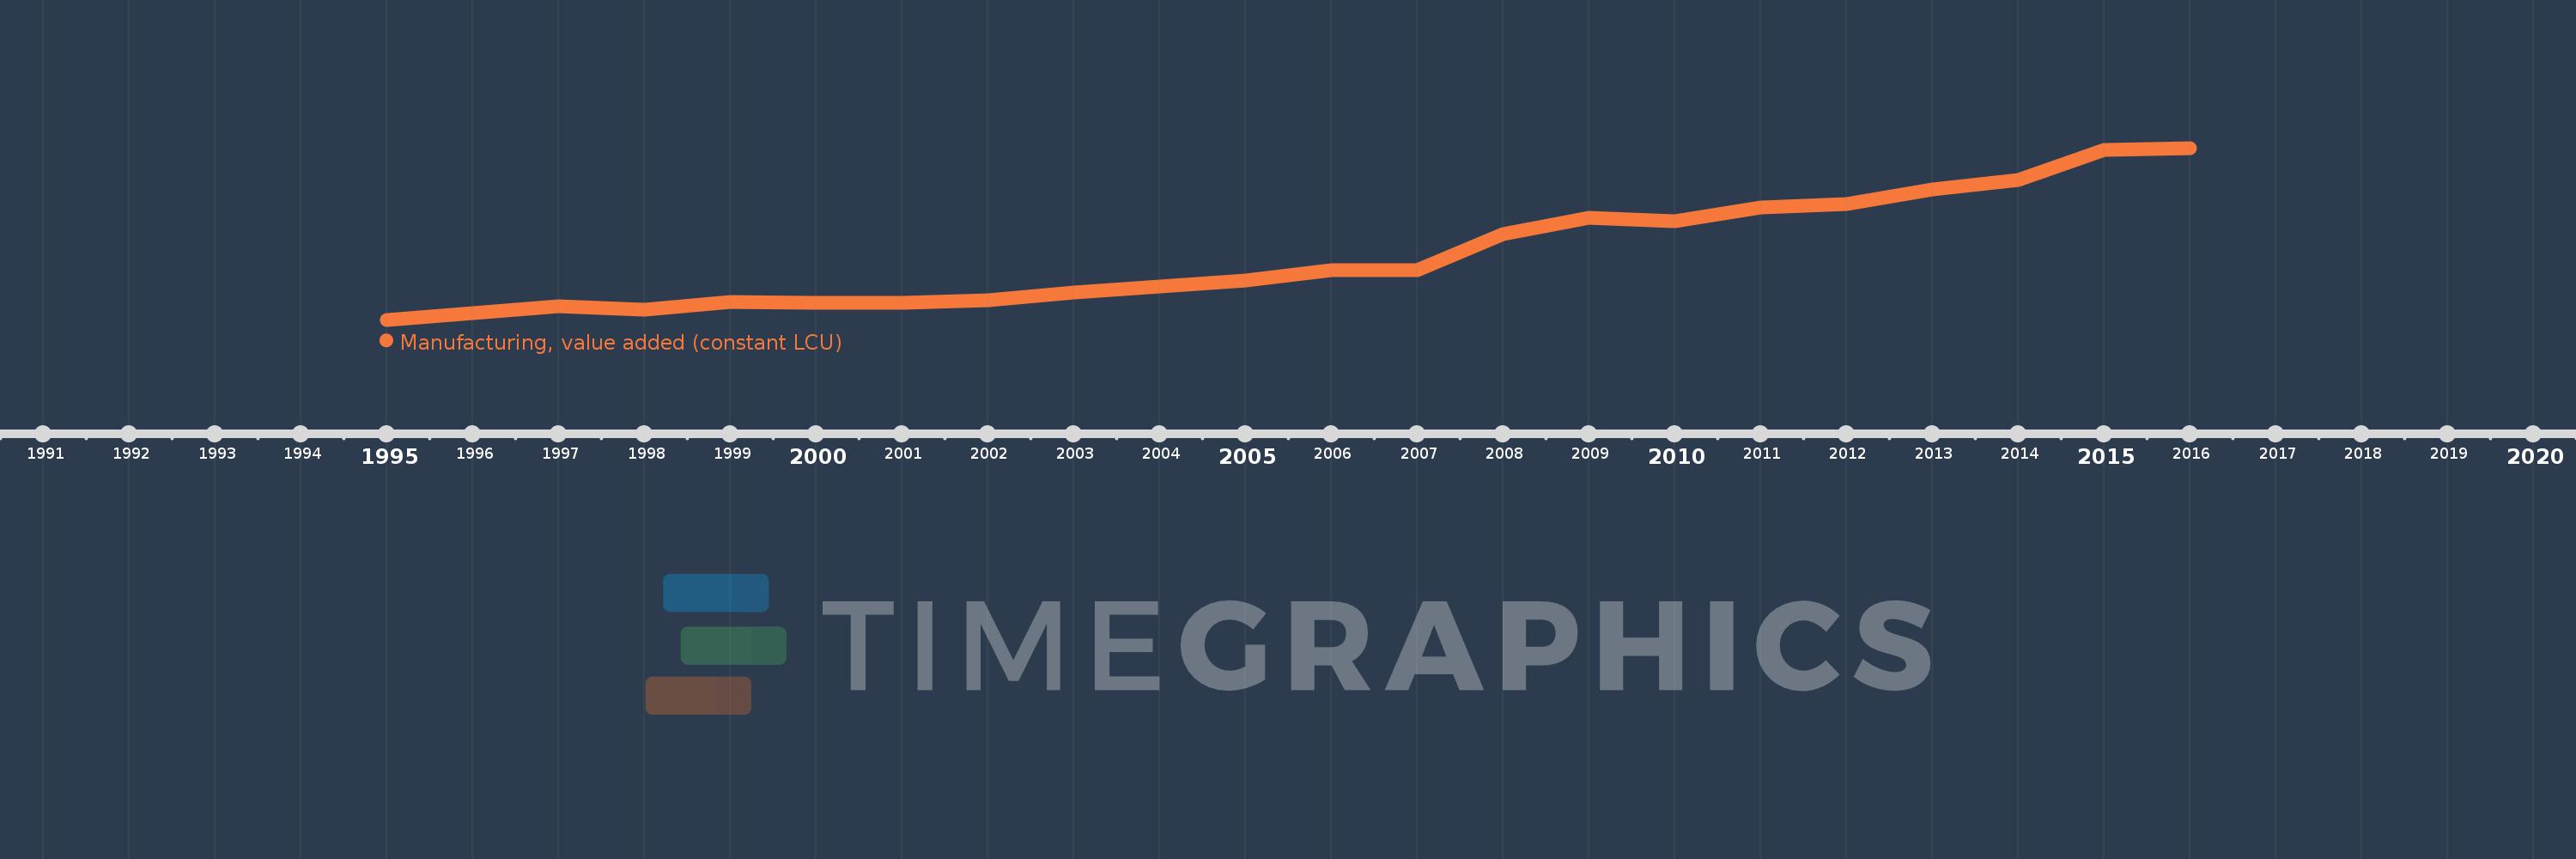
Questa scala temporale mostra un grafico dal 1995 anno al 2016 anno. Lebanon. I dati fino ad 1994 anno non disponibili. Il numero di osservazioni attuali secondo i date: 22.

La fonte (nome):

Indicatori dello sviluppo mondiale

La fonte (organizzazione):

World Bank national accounts data, and OECD National Accounts data files.

Categorie:

Economy & Growth

sono stati aggiornati

23 apr 2017 anni

Indicatori delle variazioni dei valori per anni

In media:
3.422 Trln
Minima:
2.295 Trln
1 gen 1995 anni
Massimo:
5.282 Trln
1 gen 2016 anni
Alla data di osservazione
Valore
Variazione assoluta
La variazione rispetto al valore precedente
1 gen 1995 anni
2.295 Trln
+2.295 Trln
0.0%
1 gen 1996 anni
2.404 Trln
+108.701 Mlrd
4.74%
1 gen 1997 anni
2.536 Trln
+131.688 Mlrd
5.48%
1 gen 1998 anni
2.474 Trln
-61.792 Mlrd
-2.44%
1 gen 1999 anni
2.608 Trln
+133.593 Mlrd
5.4%
1 gen 2000 anni
2.584 Trln
-23.468 Mlrd
-0.9%
1 gen 2001 anni
2.584 Trln
0.0
0.0%
1 gen 2002 anni
2.633 Trln
+49.097 Mlrd
1.9%
1 gen 2003 anni
2.77 Trln
+136.924 Mlrd
5.2%
1 gen 2004 anni
2.878 Trln
+108.033 Mlrd
3.9%
1 gen 2005 anni
2.982 Trln
+103.884 Mlrd
3.61%
1 gen 2006 anni
3.152 Trln
+170.0 Mlrd
5.7%
1 gen 2007 anni
3.163 Trln
+11.0 Mlrd
0.35%
1 gen 2008 anni
3.782 Trln
+619.0 Mlrd
19.57%
1 gen 2009 anni
4.075 Trln
+293.0 Mlrd
7.75%
1 gen 2010 anni
4.015 Trln
-60.0 Mlrd
-1.47%
1 gen 2011 anni
4.249 Trln
+234.0 Mlrd
5.83%
1 gen 2012 anni
4.304 Trln
+55.0 Mlrd
1.29%
1 gen 2013 anni
4.555 Trln
+250.855 Mlrd
5.83%
1 gen 2014 anni
4.723 Trln
+168.53 Mlrd
3.7%
1 gen 2015 anni
5.243 Trln
+519.572 Mlrd
11.0%
1 gen 2016 anni
5.282 Trln
+38.721 Mlrd
0.74%

Classificazione dei paesi secondo i statistiche attuali per anni