33
/it/
AIzaSyAYiBZKx7MnpbEhh9jyipgxe19OcubqV5w
August 1, 2025
176519
Lebanon
LBN
true
2
1
Imports of goods and services (constant LCU)
2016,2015,2014,2013,2012,2011,2010,2009,2008,2007,2006,2005,2004,2003,2002,2001,2000,1999,1998,1997,1996,1995
Download
Biblioteca di statistiche globali →Lebanon →

Imports of goods and services (constant LCU)

Queste statistiche in altri paesi:

AlbaniaAlgeriaAngolaAntigua and BarbudaArgentinaArmeniaAustraliaAustriaAzerbaijanBahamas, TheBahrainBangladeshBarbadosBelarusBelgiumBelizeBeninBhutanBoliviaBosnia and HerzegovinaBotswanaBrazilBrunei DarussalamBulgariaBurkina FasoBurundiCabo VerdeCambodiaCameroonCanadaChadChileColombiaComorosCongo, Dem. Rep.Congo, Rep.Costa RicaCote d'IvoireCroatiaCubaCyprusCzech RepublicDenmarkDjiboutiDominican RepublicEcuadorEgypt, Arab Rep.El SalvadorEquatorial GuineaEritreaEstoniaEthiopiaFijiFinlandFranceGabonGambia, TheGeorgiaGermanyGhanaGreeceGuatemalaGuineaGuinea-BissauHaitiHondurasHong Kong SAR, ChinaHungaryIcelandIndiaIndonesiaIran, Islamic Rep.IrelandIsraelItalyJamaicaJapanJordanKazakhstanKenyaKorea, Rep.KosovoKuwaitKyrgyz RepublicLao PDRLatviaLebanonLiberiaLibyaLithuaniaLuxembourgMacao SAR, ChinaMacedonia, FYRMadagascarMalawiMalaysiaMaliMaltaMauritaniaMauritiusMexicoMoldovaMongoliaMontenegroMoroccoMozambiqueMyanmarNamibiaNepalNetherlandsNew ZealandNicaraguaNigerNigeriaNorwayOmanPakistanPanamaPapua New GuineaParaguayPeruPhilippinesPolandPortugalPuerto RicoQatarRomaniaRussian FederationRwandaSamoaSaudi ArabiaSenegalSerbiaSeychellesSierra LeoneSingaporeSlovak RepublicSloveniaSomaliaSouth AfricaSouth SudanSpainSri LankaSudanSurinameSwazilandSwedenSwitzerlandSyrian Arab RepublicTajikistanTanzaniaThailandTimor-LesteTogoTrinidad and TobagoTunisiaTurkeyTurkmenistanUgandaUkraineUnited Arab EmiratesUnited KingdomUnited StatesUruguayUzbekistanVanuatuVenezuela, RBVietnamWest Bank and GazaZambiaZimbabwe

Linea del tempo:

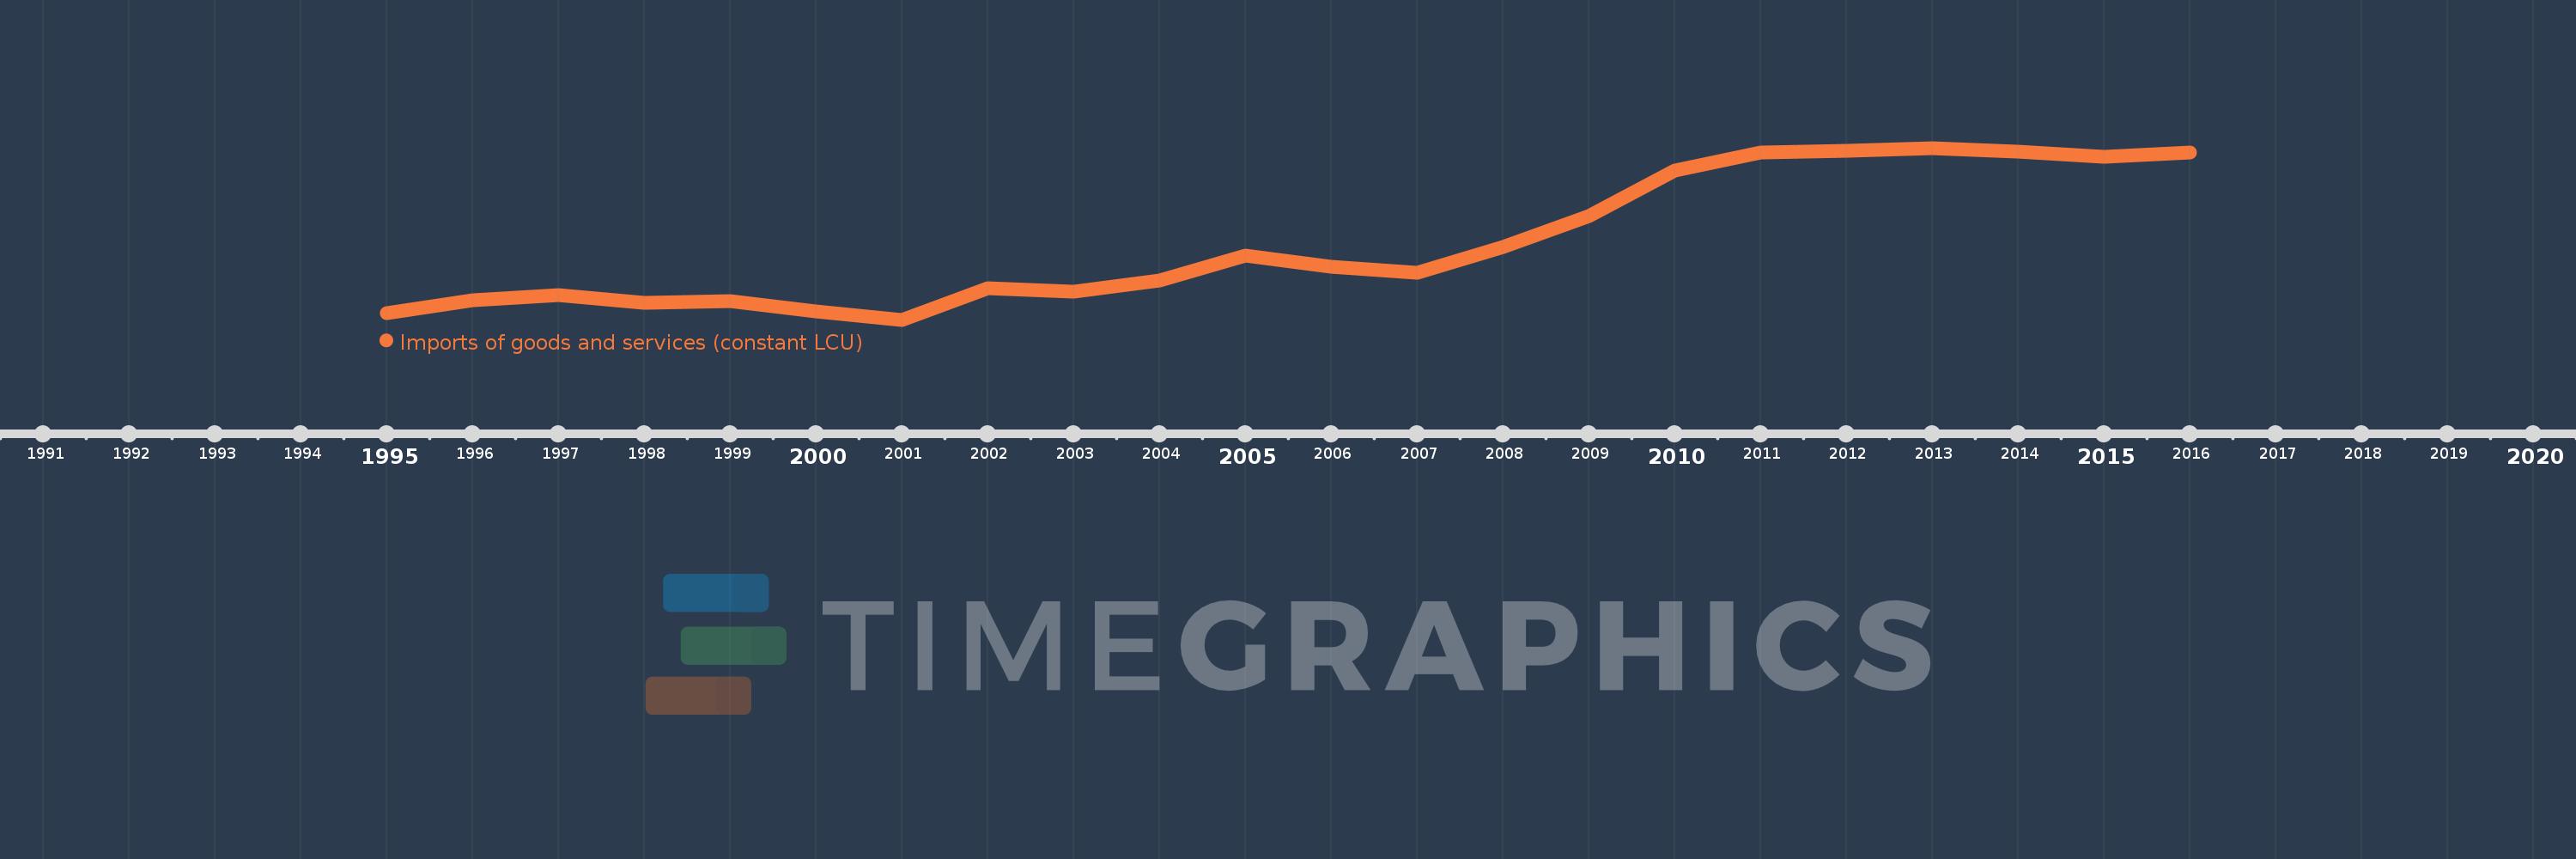
Questa scala temporale mostra un grafico dal 1995 anno al 2016 anno. Lebanon. I dati fino ad 1994 anno non disponibili. Il numero di osservazioni attuali secondo i date: 22.

La fonte (nome):

Indicatori dello sviluppo mondiale

La fonte (organizzazione):

World Bank national accounts data, and OECD National Accounts data files.

Categorie:

Economy & Growth

sono stati aggiornati

23 apr 2017 anni

Indicatori delle variazioni dei valori per anni

In media:
25.344 Trln
Minima:
16.777 Trln
1 gen 2001 anni
Massimo:
35.918 Trln
1 gen 2013 anni
Alla data di osservazione
Valore
Variazione assoluta
La variazione rispetto al valore precedente
1 gen 1995 anni
17.499 Trln
+17.499 Trln
0.0%
1 gen 1996 anni
18.97 Trln
+1.471 Trln
8.41%
1 gen 1997 anni
19.527 Trln
+557.653 Mlrd
2.94%
1 gen 1998 anni
18.624 Trln
-902.988 Mlrd
-4.62%
1 gen 1999 anni
18.867 Trln
+242.118 Mlrd
1.3%
1 gen 2000 anni
17.697 Trln
-1.17 Trln
-6.2%
1 gen 2001 anni
16.777 Trln
-920.236 Mlrd
-5.2%
1 gen 2002 anni
20.3 Trln
+3.523 Trln
21.0%
1 gen 2003 anni
19.914 Trln
-385.694 Mlrd
-1.9%
1 gen 2004 anni
21.129 Trln
+1.215 Trln
6.1%
1 gen 2005 anni
23.96 Trln
+2.831 Trln
13.4%
1 gen 2006 anni
22.72 Trln
-1.24 Trln
-5.18%
1 gen 2007 anni
22.043 Trln
-677.0 Mlrd
-2.98%
1 gen 2008 anni
24.93 Trln
+2.887 Trln
13.1%
1 gen 2009 anni
28.36 Trln
+3.43 Trln
13.76%
1 gen 2010 anni
33.379 Trln
+5.019 Trln
17.7%
1 gen 2011 anni
35.444 Trln
+2.065 Trln
6.19%
1 gen 2012 anni
35.632 Trln
+188.0 Mlrd
0.53%
1 gen 2013 anni
35.918 Trln
+285.637 Mlrd
0.8%
1 gen 2014 anni
35.5 Trln
-417.229 Mlrd
-1.16%
1 gen 2015 anni
34.974 Trln
-526.391 Mlrd
-1.48%
1 gen 2016 anni
35.408 Trln
+434.36 Mlrd
1.24%

Classificazione dei paesi secondo i statistiche attuali per anni