33
/it/
AIzaSyAYiBZKx7MnpbEhh9jyipgxe19OcubqV5w
August 1, 2025
176383
Lebanon
LBN
true
2
1
GDP (current LCU)
2016,2015,2014,2013,2012,2011,2010,2009,2008,2007,2006,2005,2004,2003,2002,2001,2000,1999,1998,1997,1996,1995,1994,1993,1992,1991,1990,1989
Download
Biblioteca di statistiche globali →Lebanon →

GDP (current LCU)

Queste statistiche in altri paesi:

AfghanistanAlbaniaAlgeriaAndorraAngolaAntigua and BarbudaArgentinaArmeniaArubaAustraliaAustriaAzerbaijanBahamas, TheBahrainBangladeshBarbadosBelarusBelgiumBelizeBeninBermudaBhutanBoliviaBosnia and HerzegovinaBotswanaBrazilBrunei DarussalamBulgariaBurkina FasoBurundiCabo VerdeCambodiaCameroonCanadaCayman IslandsCentral African RepublicChadChannel IslandsChileChinaColombiaComorosCongo, Dem. Rep.Congo, Rep.Costa RicaCote d'IvoireCroatiaCubaCyprusCzech RepublicDenmarkDjiboutiDominicaDominican RepublicEcuadorEgypt, Arab Rep.El SalvadorEquatorial GuineaEritreaEstoniaEthiopiaFaroe IslandsFijiFinlandFranceFrench PolynesiaGabonGambia, TheGeorgiaGermanyGhanaGreeceGreenlandGrenadaGuatemalaGuineaGuinea-BissauGuyanaHaitiHondurasHong Kong SAR, ChinaHungaryIcelandIndiaIndonesiaIran, Islamic Rep.IraqIrelandIsle of ManIsraelItalyJamaicaJapanJordanKazakhstanKenyaKiribatiKorea, Rep.KosovoKuwaitKyrgyz RepublicLao PDRLatviaLebanonLesothoLiberiaLibyaLiechtensteinLithuaniaLuxembourgMacao SAR, ChinaMacedonia, FYRMadagascarMalawiMalaysiaMaldivesMaliMaltaMarshall IslandsMauritaniaMauritiusMexicoMicronesia, Fed. Sts.MoldovaMonacoMongoliaMontenegroMoroccoMozambiqueMyanmarNamibiaNauruNepalNetherlandsNew CaledoniaNew ZealandNicaraguaNigerNigeriaNorwayOmanPakistanPalauPanamaPapua New GuineaParaguayPeruPhilippinesPolandPortugalPuerto RicoQatarRomaniaRussian FederationRwandaSamoaSan MarinoSao Tome and PrincipeSaudi ArabiaSenegalSerbiaSeychellesSierra LeoneSingaporeSint Maarten (Dutch part)Slovak RepublicSloveniaSolomon IslandsSomaliaSouth AfricaSouth SudanSpainSri LankaSt. Kitts and NevisSt. LuciaSt. Vincent and the GrenadinesSudanSurinameSwazilandSwedenSwitzerlandSyrian Arab RepublicTajikistanTanzaniaThailandTimor-LesteTogoTongaTrinidad and TobagoTunisiaTurkeyTurkmenistanTuvaluUgandaUkraineUnited Arab EmiratesUnited KingdomUnited StatesUruguayUzbekistanVanuatuVenezuela, RBVietnamVirgin Islands (U.S.)West Bank and GazaYemen, Rep.ZambiaZimbabwe

Linea del tempo:

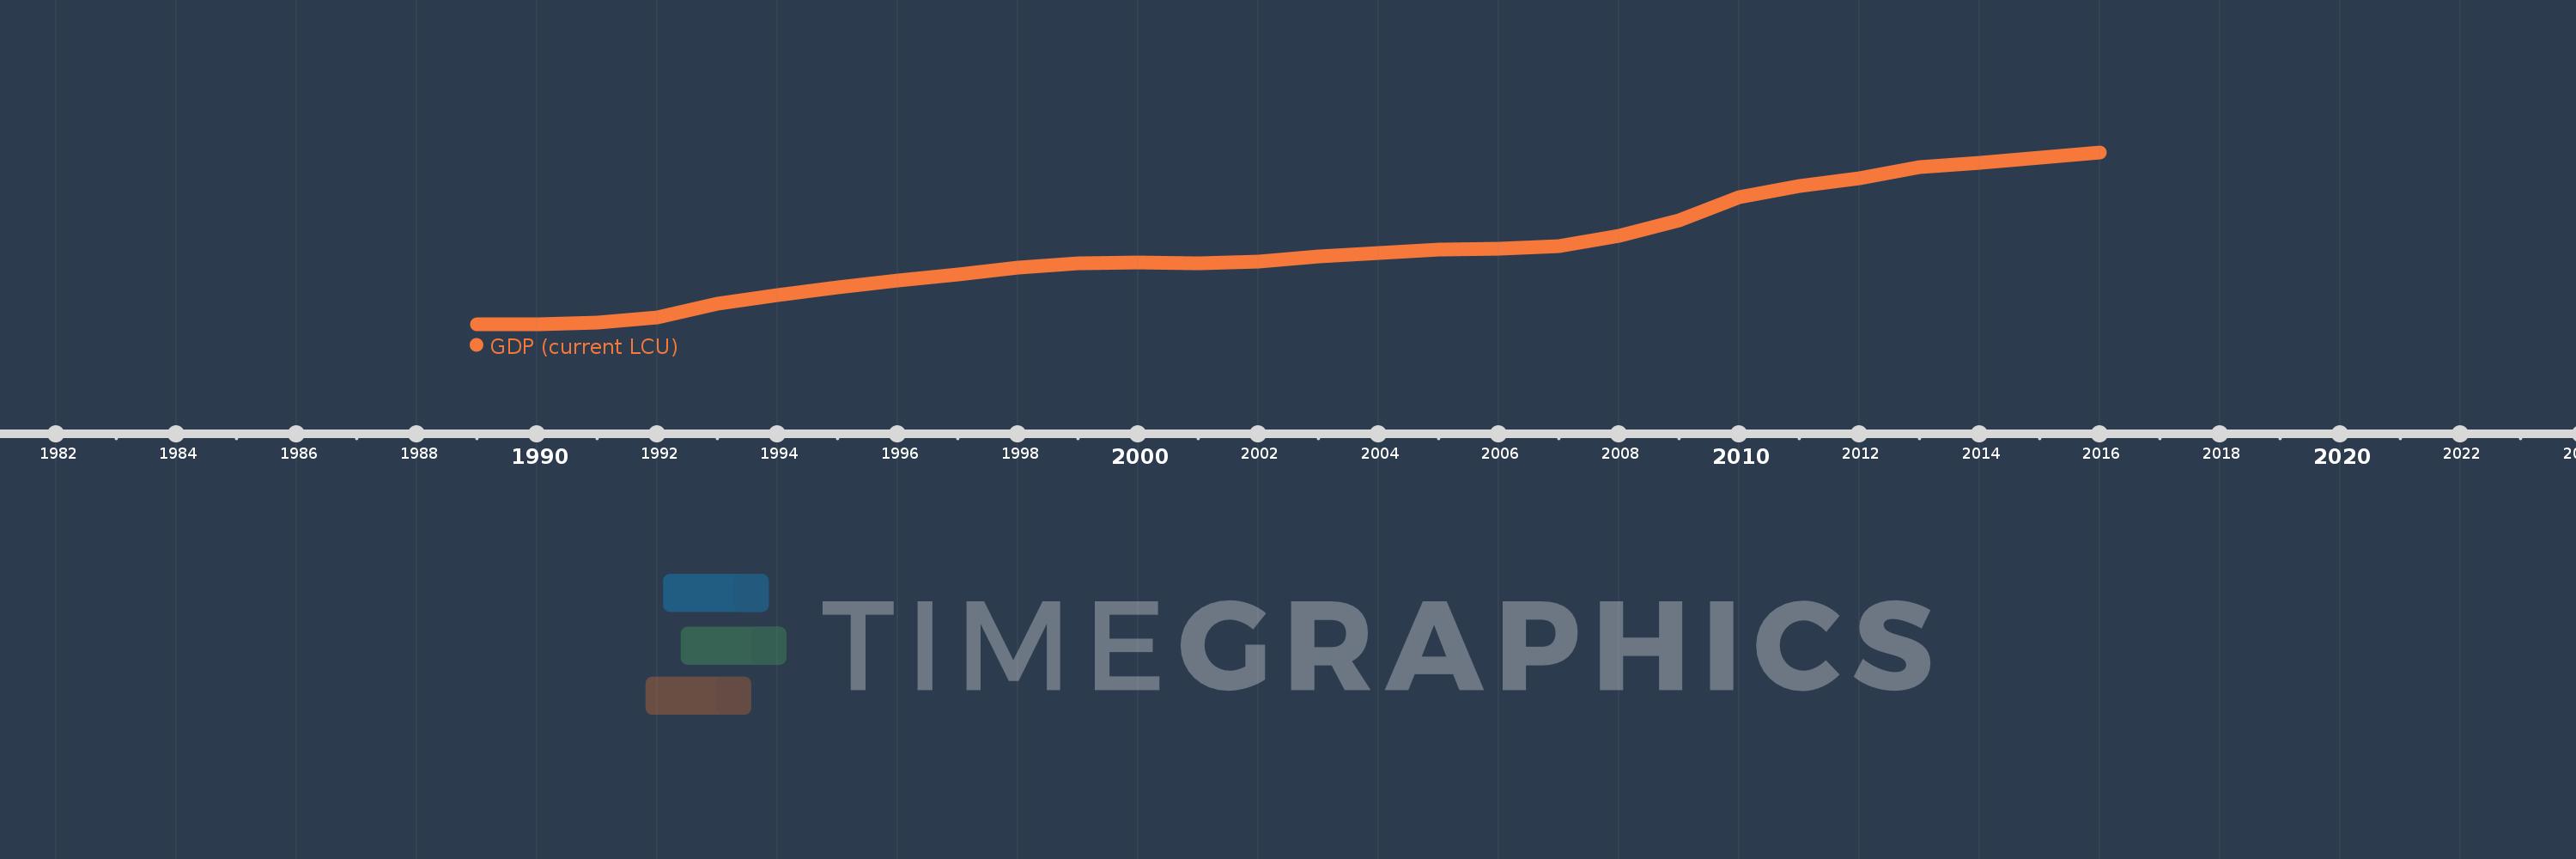
Questa scala temporale mostra un grafico dal 1989 anno al 2016 anno. Lebanon. I dati fino ad 1988 anno non disponibili. Il numero di osservazioni attuali secondo i date: 28.

La fonte (nome):

Indicatori dello sviluppo mondiale

La fonte (organizzazione):

World Bank national accounts data, and OECD National Accounts data files.

Categorie:

Economy & Growth

sono stati aggiornati

23 apr 2017 anni

Indicatori delle variazioni dei valori per anni

In media:
32.004 Trln
Minima:
1.35 Trln
1 gen 1990 anni
Massimo:
70.98 Trln
1 gen 2016 anni
Alla data di osservazione
Valore
Variazione assoluta
La variazione rispetto al valore precedente
1 gen 1989 anni
1.356 Trln
+1.356 Trln
0.0%
1 gen 1990 anni
1.35 Trln
-6.0 Mlrd
-0.44%
1 gen 1991 anni
1.973 Trln
+623.0 Mlrd
46.15%
1 gen 1992 anni
4.132 Trln
+2.159 Trln
109.43%
1 gen 1993 anni
9.499 Trln
+5.367 Trln
129.89%
1 gen 1994 anni
13.122 Trln
+3.623 Trln
38.14%
1 gen 1995 anni
16.127 Trln
+3.006 Trln
22.91%
1 gen 1996 anni
19.001 Trln
+2.873 Trln
17.82%
1 gen 1997 anni
21.513 Trln
+2.512 Trln
13.22%
1 gen 1998 anni
24.25 Trln
+2.737 Trln
12.72%
1 gen 1999 anni
26.149 Trln
+1.899 Trln
7.83%
1 gen 2000 anni
26.223 Trln
+74.0 Mlrd
0.28%
1 gen 2001 anni
26.02 Trln
-203.0 Mlrd
-0.77%
1 gen 2002 anni
26.607 Trln
+587.0 Mlrd
2.26%
1 gen 2003 anni
28.872 Trln
+2.265 Trln
8.51%
1 gen 2004 anni
30.275 Trln
+1.403 Trln
4.86%
1 gen 2005 anni
31.59 Trln
+1.315 Trln
4.34%
1 gen 2006 anni
32.091 Trln
+501.0 Mlrd
1.59%
1 gen 2007 anni
32.858 Trln
+767.0 Mlrd
2.39%
1 gen 2008 anni
37.05 Trln
+4.192 Trln
12.76%
1 gen 2009 anni
43.461 Trln
+6.411 Trln
17.3%
1 gen 2010 anni
52.973 Trln
+9.512 Trln
21.89%
1 gen 2011 anni
57.3 Trln
+4.327 Trln
8.17%
1 gen 2012 anni
60.419 Trln
+3.119 Trln
5.44%
1 gen 2013 anni
65.132 Trln
+4.713 Trln
7.8%
1 gen 2014 anni
66.861 Trln
+1.73 Trln
2.66%
1 gen 2015 anni
68.939 Trln
+2.078 Trln
3.11%
1 gen 2016 anni
70.98 Trln
+2.041 Trln
2.96%

Classificazione dei paesi secondo i statistiche attuali per anni